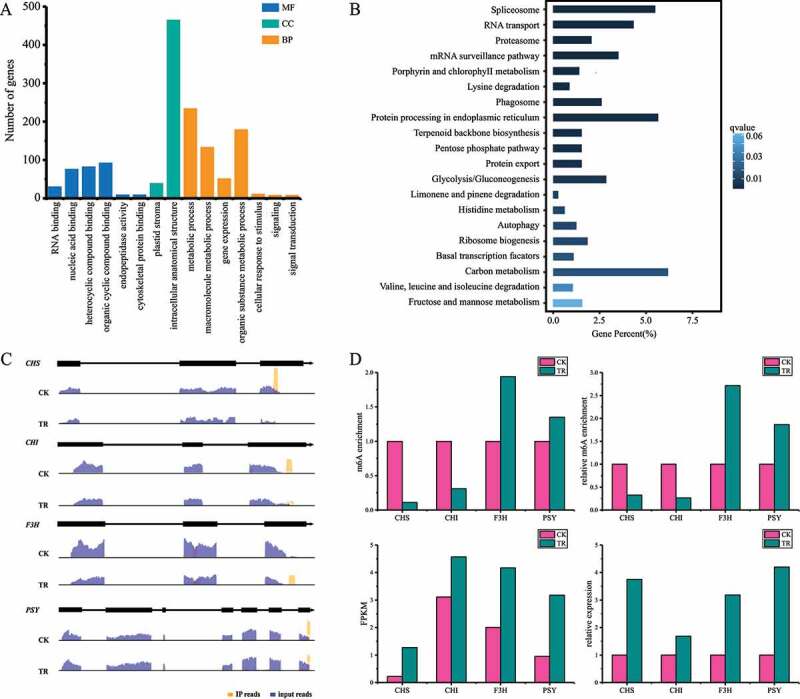
Figure 2.

Enrichment analysis of genes with m6A peaks. (a) GO enrichment of genes with m6A peaks. MF: Molecular Function, CC: Cellular Component, BP: Biological Process. (b) KEGG enrichment of genes with m6A peaks. (c) Examples of genes with m6A peaks at stop codon
