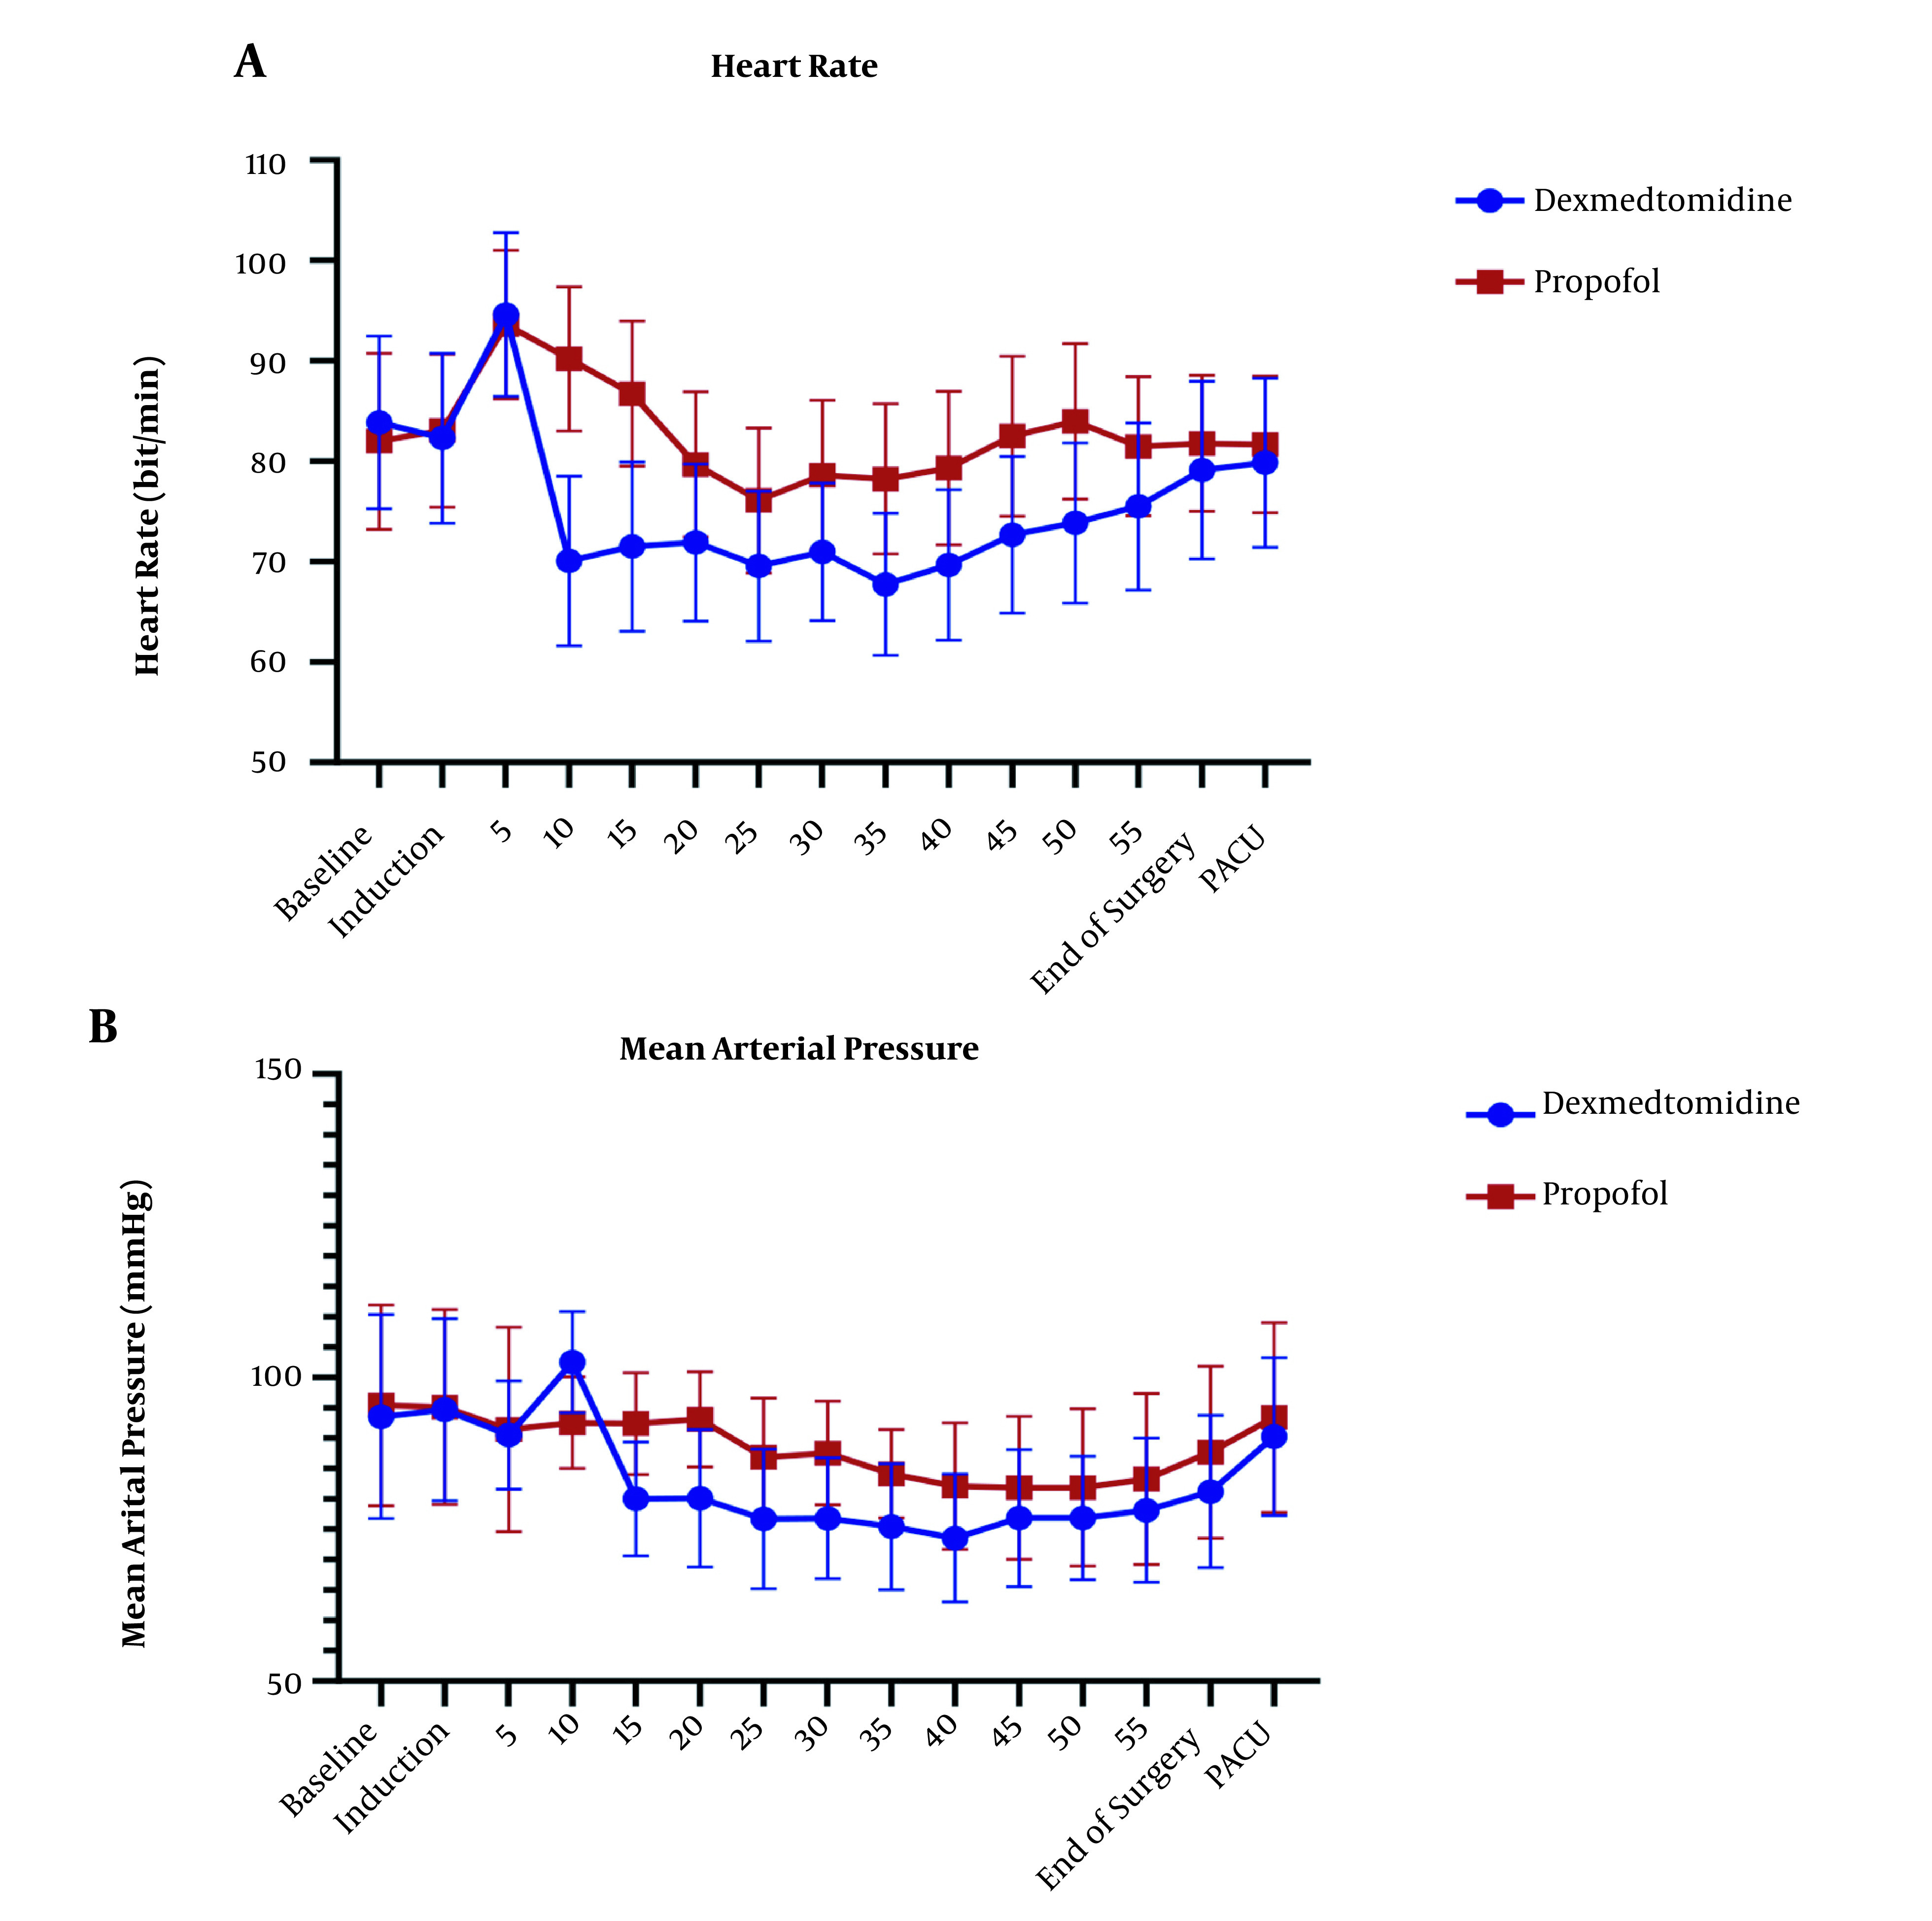
Figure 3. (A) Changes in heart rate (HR) in the P group (n = 34,) and the D group (n = 34). Preoperative (-20), operative, and postoperative (PACU) measurements. P < 0.001 (Repeated measure ANOVA). (B) Changes in mean arterial pressure (MAP) in the P group (n = 34) and the D group (n = 34). Preoperative (-20), operative, and postoperative (PACU) measurements. P < 0.001 (Repeated measure ANOVA).

