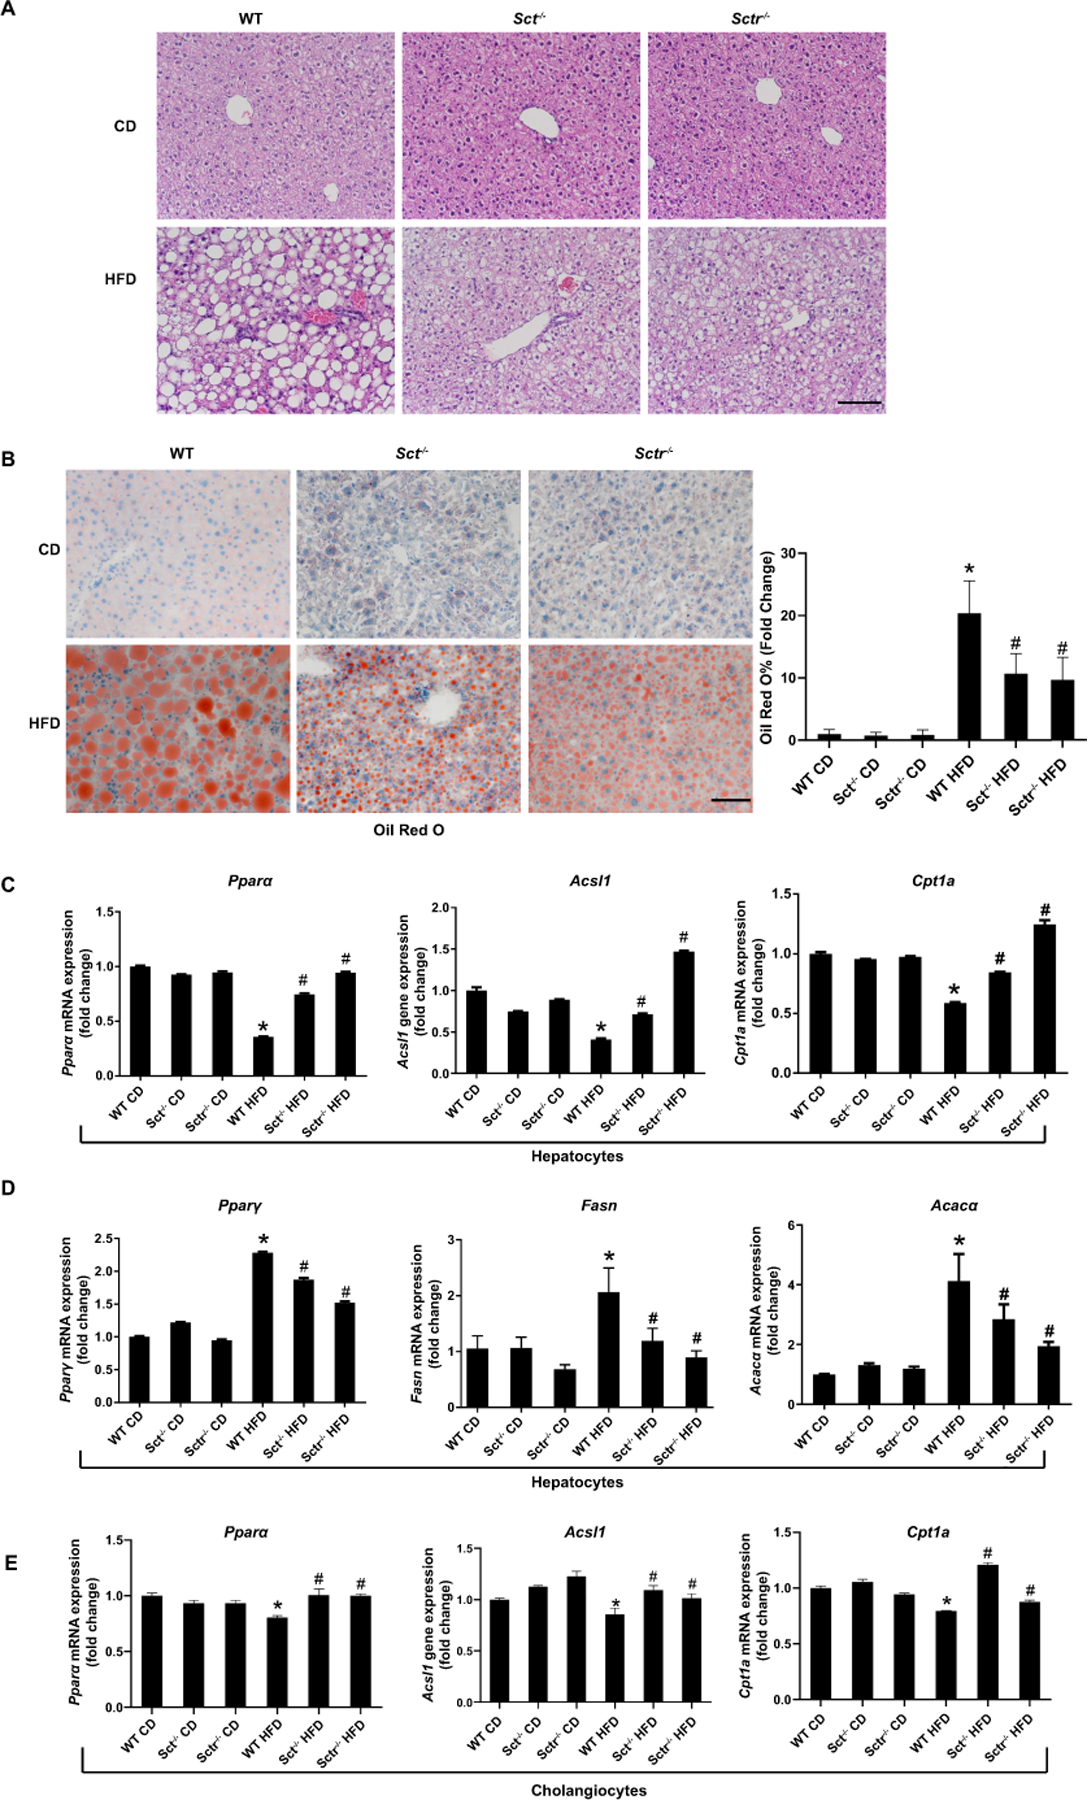
Figure 2. SCT or SCTR knockout protects against HFD-induced steatosis.

(A) Representative H&E images in liver from Sct-/- and Sctr-/- HFD mice (n=8; 20×; scale bar, 50 μm). (B) Representative images of Oil Red O staining in Sct-/- and Sctr-/- HFD mice. (n=24 from 8 different mice; 20×; scale bar, 50 μm). (C) Fatty acid oxidation genes Pparα, Acsl1 and Cpt1α expression in hepatocytes from Sct-/- and Sctr-/- HFD mice (n=3 reactions from samples obtained from a cumulative cell preparation from 8 mice). (D) The expression of adipogenesis gene Pparγ, Fasn and Acacα in hepatocytes from Sct-/- and Sctr-/- HFD mice (n=3 reactions from samples obtained from a cumulative cell preparation from 8 mice). (E) The expression fatty acid oxidation gene (Pparα, Acsl1 and Cpt1α) expression in cholangiocytes from Sct-/- and Sctr-/- HFD mice (n=3 reactions from samples obtained from a cumulative cell preparation from 8 mice). Data are mean ± SD. *P <0.05 versus WT CD, #P <0.05 versus WT HFD.
