
Fig. 3.
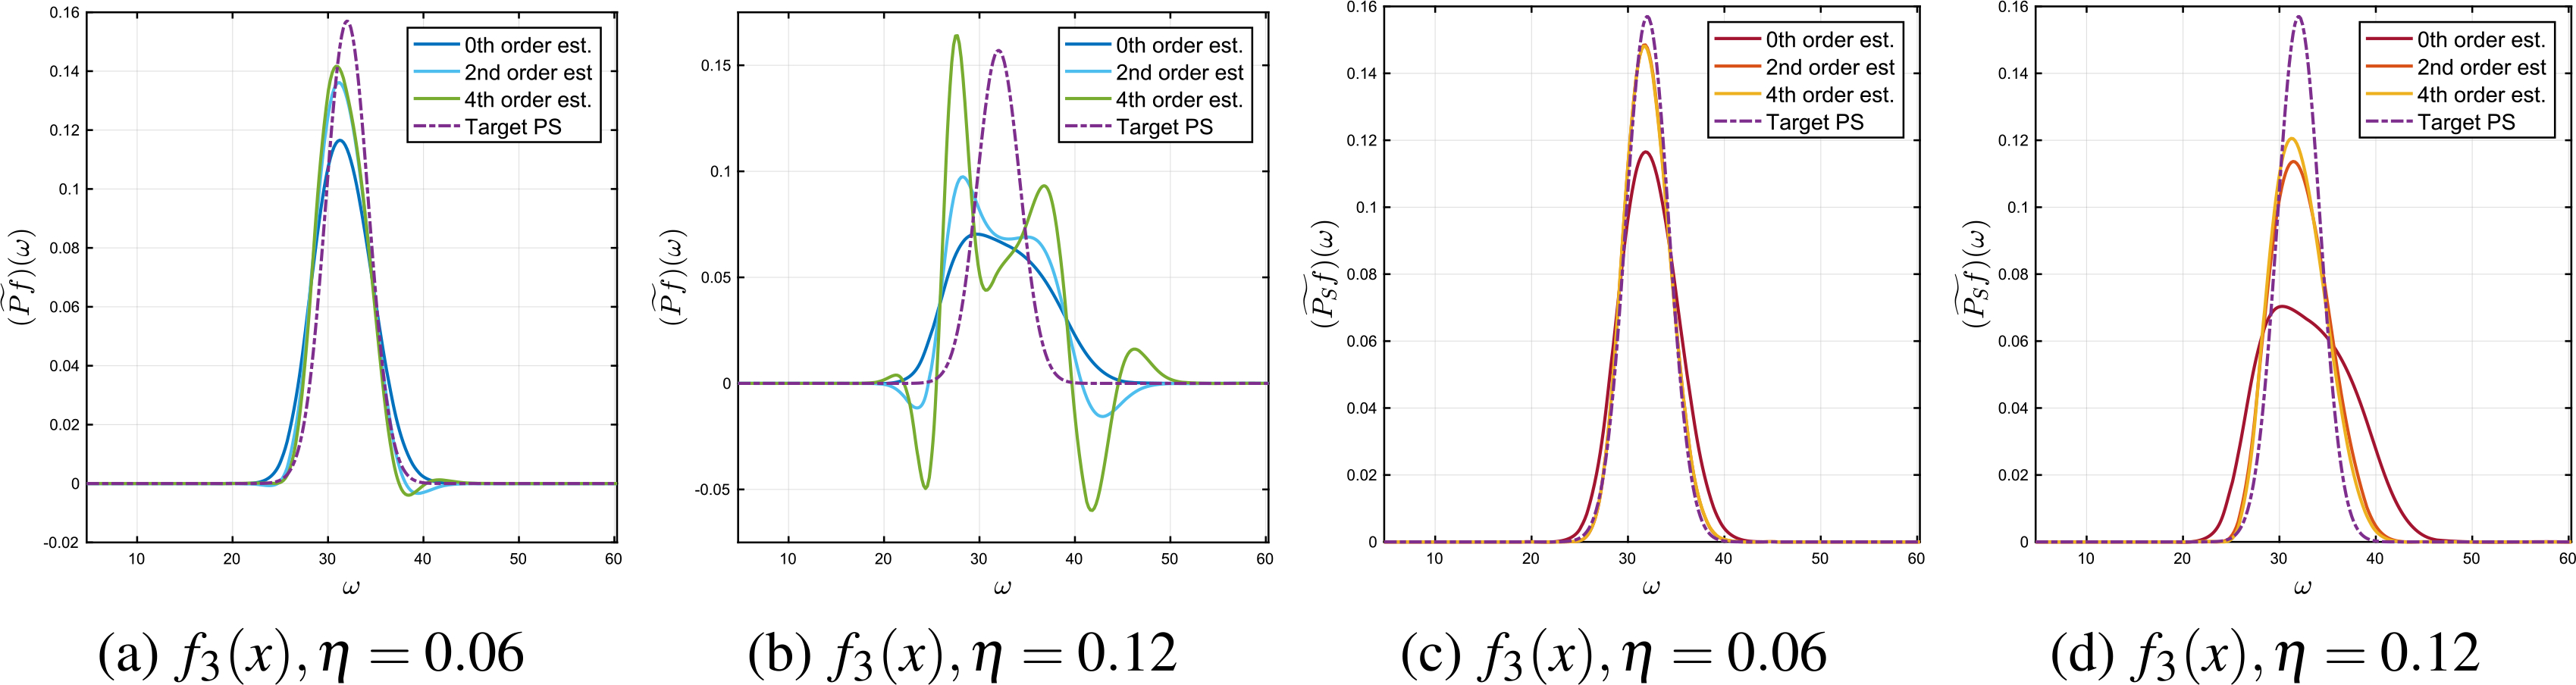
Order k = 0, 2, 4 power spectrum estimators (first two figures) and wavelet invariant estimators (last two figures) for the signal . Figures 3(a) and 3(c) show small dilations and Figs 3(b) and 3(d) show large dilations.
Official websites use .gov
A
.gov website belongs to an official
government organization in the United States.
Secure .gov websites use HTTPS
A lock (
) or https:// means you've safely
connected to the .gov website. Share sensitive
information only on official, secure websites.
Order k = 0, 2, 4 power spectrum estimators (first two figures) and wavelet invariant estimators (last two figures) for the signal . Figures 3(a) and 3(c) show small dilations and Figs 3(b) and 3(d) show large dilations.