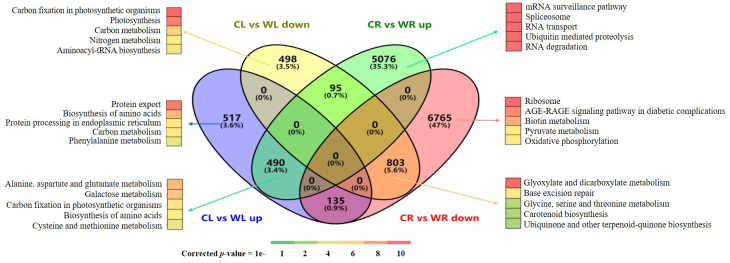
Fig 2. Venn diagrams of the differentially expressed genes under waterlogging treatment in the leaf and root samples (FDR corrected p-value of ≤ 0.01 and fold change ≥ 2) and their respective top five most significantly enriched KEGG pathways.
The numbers of DEGs exclusively up- or down-regulated in one tissue are shown in each circle. The numbers of DEGs with a common or opposite tendency of expression changes between the two tissues are shown in the overlapping regions. Only the top 5 enriched pathway terms are shown.

