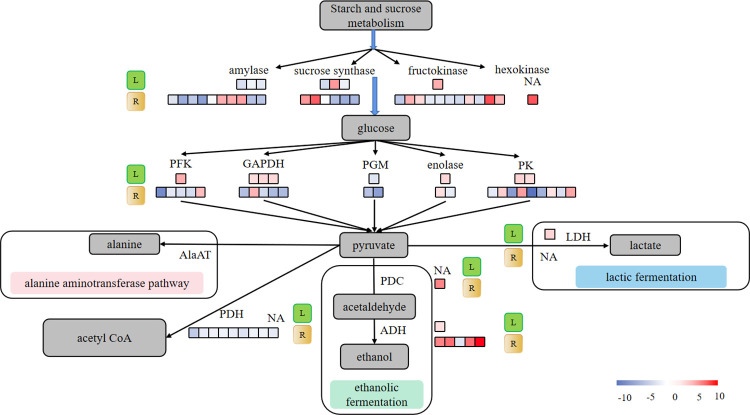
Fig 5. Schematic diagram of glycolysis and fermentation proposed during plant waterlogging stress.
AlaAT, alanine aminotransferase; GAPDH, glyceraldehyde 3-phosphate dehydrogenase; PDC, pyruvate decarboxylase; ADH, alcohol dehydrogenase; PFK, 6-phosphofructokinase; PK, pyruvate kinase; LDH, lactic dehydrogenase; PDH, pyruvate dehydrogenase; PGM, phosphoglucomutase. L, leaves; R, roots; The color of the boxes represents the fold-change value of DEGs. The number of boxes represents the number of DEGs. NA indicates that there are no DEGs encoding the enzyme. The pathway was designed based on KEGG pathways (http://www.kegg.jp/kegg/pathway.html).

