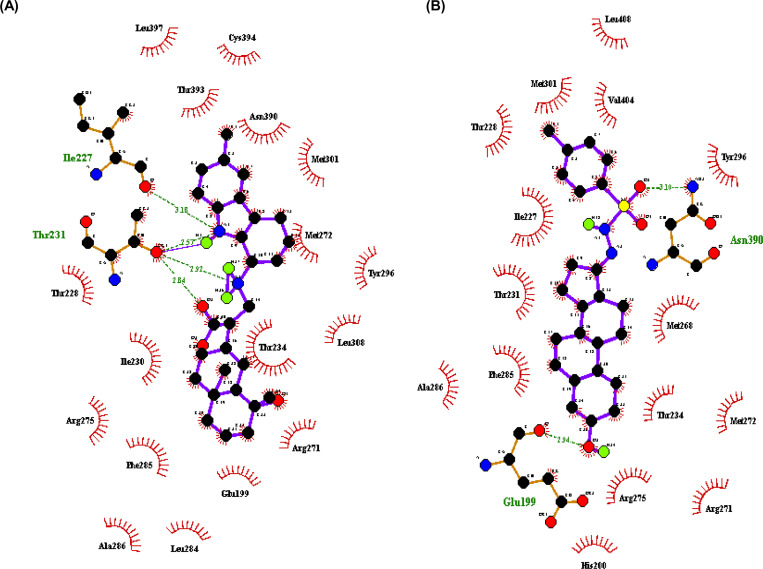
Fig 1. Protein-ligand interaction analysis.
(A) BtEcR-ZINC08952607 docked complex structure generated through Ligplot showing hydrogen bonds with amino acid residues Thr231 and Ile227 as green lines and hydrophobic interactions as red arcs. (B) BtEcR-ZINC04264850 docked complex structure generated through Ligplot showing hydrogen bonds with amino acid residues Glu199 and Asn390 as green lines and hydrophobic interactions as red arcs.

