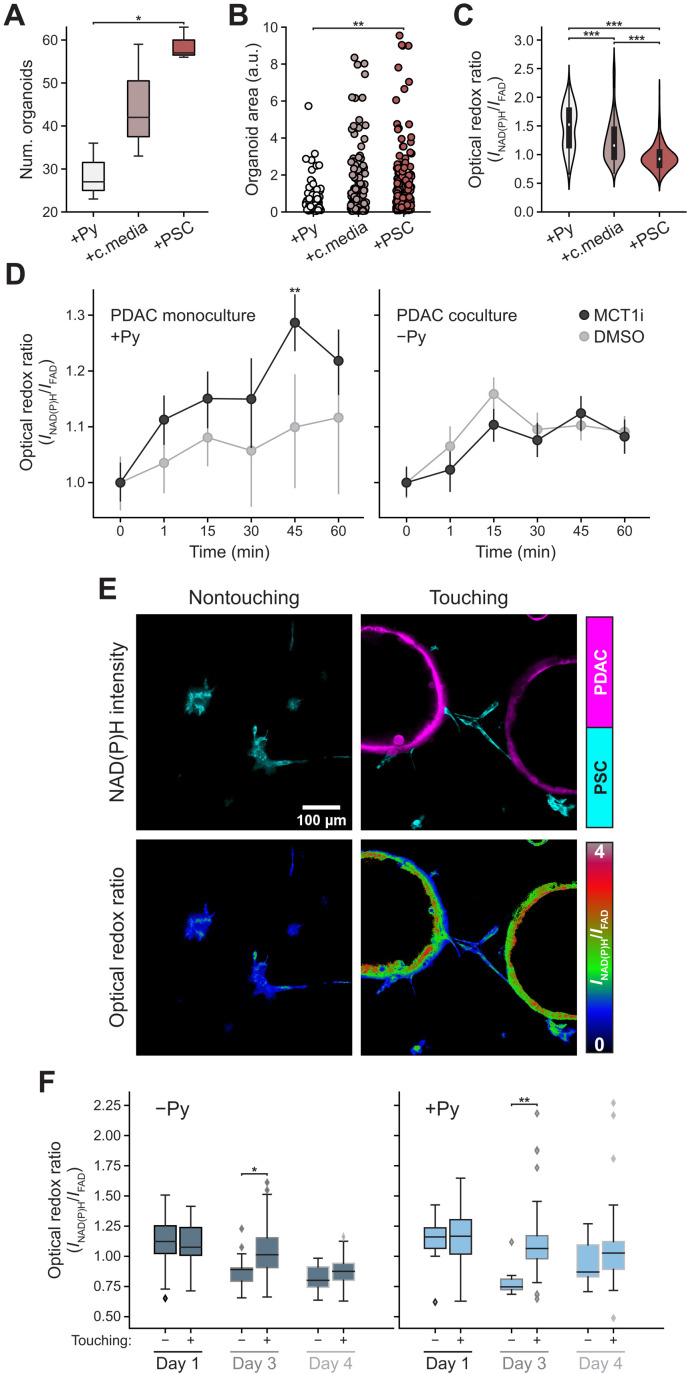
Fig. 4. Physical interactions between PSCs and PDAC cells influence the redox state of both cell types and organoid growth.
(A and B) Organoid number (A) and area (B) of PDAC cells in media with 10 mM pyruvate (+Py) for 4 days, DMEM media for 2 days and then PSC conditioned media (+c.media) added for 2 days, or coculture with PSCs (+PSC) for 4 days. Each data point is one organoid (n = 6 images per condition from three independent cultures). One-way ANOVA with post hoc Tukey’s test. (C) Optical redox ratio from (A) for each PDAC cell segmented from organoids and normalized to PDAC cells without pyruvate. n (+Py) = 201; n (+c.media) = 329; n (+PSC) = 347. Some data are subset of data in Fig. 3E. One-way ANOVA with post hoc Tukey’s test. (D) PDAC cells as 3D organoids in media with 10 mM pyruvate (PDAC monoculture +Py) or coculture with PSCs without pyruvate (PDAC coculture −Py) both for 3 days, followed by MCT1 inhibitor [AZD 3965 (100 nM)] or dimethyl sulfoxide (DMSO). Optical redox ratio at pretreatment (time 0) or indicated time. Optical redox ratio for each PDAC cell (min n = 300 cells) segmented from organoids normalized to 0 min; n = 6 images per condition per time point from three independent cultures. ANOVA and Tukey’s post hoc test. (E) NAD(P)H intensity images of PSCs (cyan) of nontouching (left) or touching (right) reflecting proximity to PDAC cells as organoids (magenta) in cocultures (top) or corresponding optical redox images (bottom). PSCs within 454-μm field-of-view of each organoid assigned to touching group, rest to nontouching group. (F) Optical redox ratio of nontouching or touching PSCs with or without 10 mM pyruvate (Py) for indicated time. n = 6 images from three independent cultures. Computed at the single-cell level; normalized to PDAC cells in monoculture without pyruvate for each day. Cells per condition, table S2. T test. (***P < 0.001; **P < 0.01; *P < 0.05).

