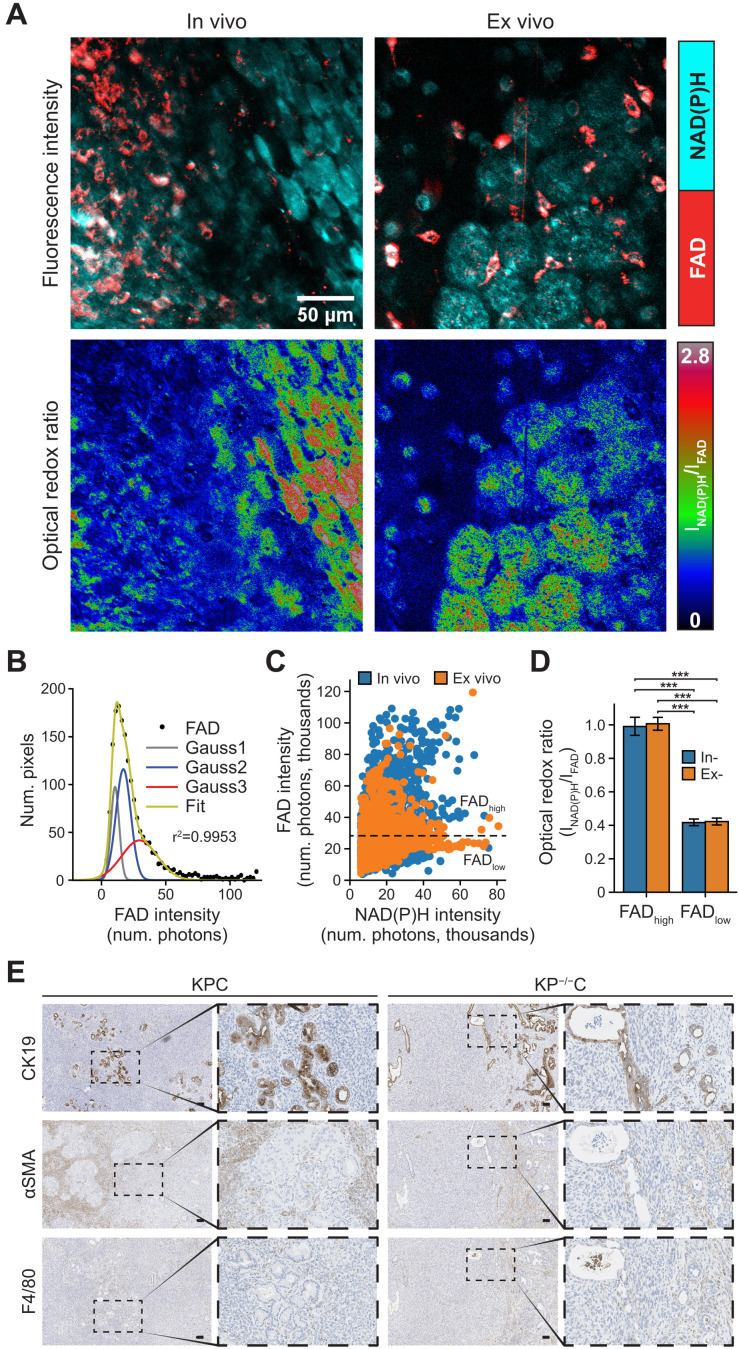
Fig. 5. Cells in pancreatic tumors exhibit distinct redox states.
(A) Representative NAD(P)H (cyan) and FAD (red) intensity images (top) and corresponding optical redox ratio images (bottom), obtained from imaging in vivo and freshly excised (ex vivo) pancreatic tumor tissue. Imaging was performed on tumors and tumor tissue from both LSL-KRasG12D; Trp53 R172H/+; Pdx1-Cre (KPC) and LSL-KRasG12D; Trp53 fl/fl; Pdx1-Cre (KP−/−C) mice. (B) Gaussian fit (green curve) was performed on FAD intensity (black solid circles) with the goodness of fit of (r2 = 0.9953). Gray (Gauss1), blue (Gauss2), and red (Gauss3) curves represent the best three-component Gaussian fits. The intersecting point between Gauss2 and Gauss3 was computed to be 25.3 × 10³ photons. (C) Scatterplot of FAD versus NAD(P)H intensity computed from nine in vivo and eight ex vivo tissue images as indicated (n = 4 mice). Each data point is regions of interest (ROIs) segmented from NAD(P)H and FAD intensity images, n (in vivo) = 3990, n (ex vivo) = 4647. Black dotted line is drawn at 25.3 × 10³ photons, the intersecting point calculated in (B) and serves as the threshold between high FAD intensity regions (FADhigh) and low FAD intensity regions (FADlow). (D) Optical redox ratio from in vivo and ex vivo images for regions within FADlow (bulk tissue, low FAD intensity) and FADhigh (interspersed high FAD intensity cells) (n = 17 images analyzed). The optical redox ratio for each image was normalized to its FADhigh regions. Statistical significance was tested using one-way ANOVA with post hoc Tukey’s test. (***P < 0.001). Error bars are the SD. (E) Representative immunohistochemistry images of PDAC tumors from KPC and KP−/−C mice stained for the PDAC cell marker CK19 (top), fibroblast marker αSMA (middle), or macrophage marker F4/80 (bottom). Scale bars, 100 μm.

