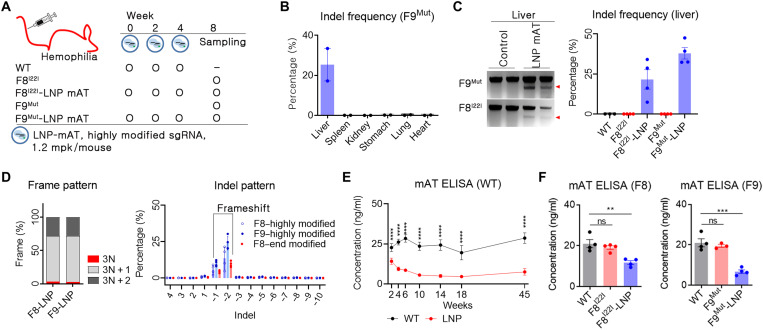
Fig. 3. LNP-CRISPR-mAT induced a prolonged down-regulation of mAT expression.
(A) Brief schematic for the in vivo gene targeting using LNP-CRISPR-mAT. C57BL6 (B6, n = 4), B6.FVIII intron 22 inversion (F8I22I, n = 4 in each group), and B6.FIX knockout (F9Mut, n = 4 in each group) mice were used in this study. (B and C) Indel frequency was calculated by deep sequencing and confirmed using T7E1 analysis (number of each group, 2 or 4). Data are shown as means ± SEM. (D) Indel pattern was analyzed according to frameshift and indel size (number of each group, 3 or 4). Each dot indicates the percentage of each sized indel from the total sequencing result. (E) Prolonged AT down-regulation was screened by ELISA using B6 mice (n = 6 per group). Blood was collected from the tail vein using a sodium citrate–coated tube, and the plasma was subjected to mAT ELISA. ****P < 0.0001. (F) Blood mAT concentration was measured and compared between the LNP-CRISPR-mAT–treated and the control hemophilia mice group. Each dot indicates the mAT concentration of an individual mouse (number of each group, 3 or 4). Data are presented as means ± SEM. **P < 0.01 and ***P < 0.001; ns, nonsignificant.

