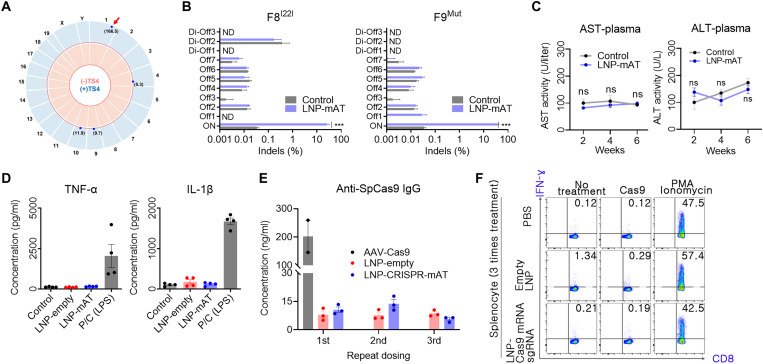
Fig. 6. Safety-related assessments of the LNP-CRISPR-Cas9.
(A) Genome-wide Circos plot for in vitro cleavage sites in the absence (pink) or presence (blue) of the TS4 sgRNA. Numbers in bracket: cleavage scores. Red arrow: on-target cleavage (B) Targeted deep sequencing results of the top seven homologous candidates (Offs) and the three candidates detected by the Digenome-seq analysis (Di-Offs) (n = 3). ND, not detected; ***P < 0.001. (C) Serum AST and ALT concentrations after injection with 1.2 mpk of LNP-CRISPR-mAT thrice to WT at an interval of 2 weeks (n = 6). (D) Serum TNF-α and IL-1β concentration after injection with 1.2 mpk of LNP or LNP-CRISPR-mAT thrice. Positive control group was injected 20 mpk of lipopolysaccharide (n = 4). (E) Serum anti-SpCas9 IgG concentration after repeated injection with LNP-CRISPR-mAT (n = 3). Mouse intravenously injected with AAV9-EFS-SpCas9 (5 × 10¹³ vg/kg) was also tested after 6 weeks of the treatment. The concentrations were calculated from the standard curve from ELISA (R2 = 0.989). (F) Representative flow cytometry plots illustrating IFN-γ expression in CD8+ T cells. IFN-γ expression in CD8+ T cells was evaluated after repeated injections of PBS, empty LNPs, and sgRNA/Cas9 mRNA–encapsulated LNPs to mice (n = 3). Detailed results are supplied in fig. S5.

