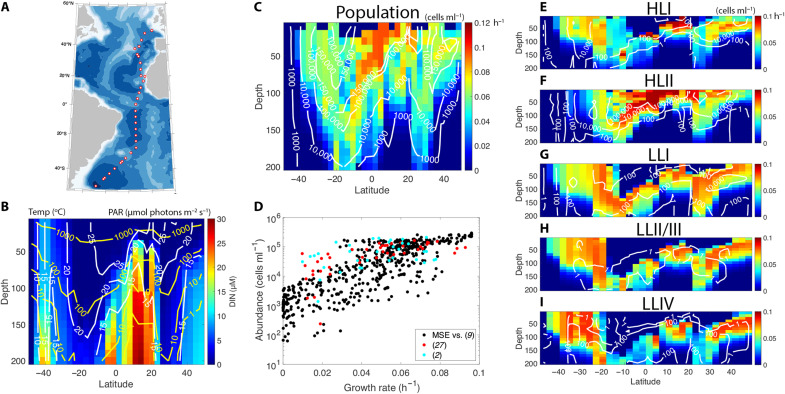
Fig. 2. Summary of AMT-13 cruise simulation.
(A) Cruise track of the AMT-13 expedition during the fall of 2003. (B) Meridional sections of observed temperature (white contours), photosynthetically active radiation PAR; (yellow contours, logarithmically spaced), and dissolved inorganic nitrogen (DIN; heatmap). (C) Meridional sections of observed Prochlorococcus abundances (white contours, logarithmically spaced) and predicted population growth rates (heatmap). (D) Observed Prochlorococcus population abundance plotted against predicted population growth rates (black markers). Red and blue markers correspond to previously published datasets. (E to I) Meridional sections of measured Prochlorococcus ecotype abundances (white contours, logarithmically spaced) and predicted growth rates (heatmaps). Although the LLII/III ecotype was nearly absent from the entire transect, Johnson et al. (9) note that quantitative polymerase chain reaction primers for this ecotype may have been contaminated.

