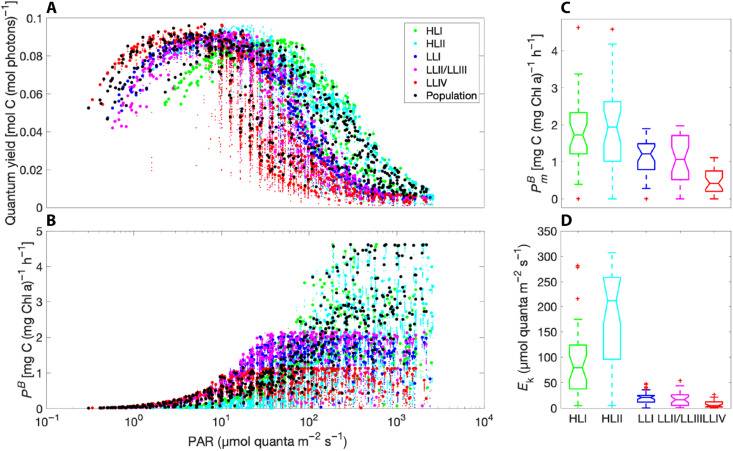
Fig. 3. Photoacclimation and photosynthesis.
(A) Predicted QY of photosynthesis (moles C fixed by ribulose 1,5-bisphosphate carboxylase per mole photons absorbed by light-harvesting pigments) over the range of in situ irradiance levels for all strains (small markers), ecotypes (large markers), and the total population (large black markers) across all samples. (B) Predicted photosynthetic rate normalized to the predicted chlorophyll against irradiance for all strains, ecotypes, and the total population across all samples. Box-and-whisker plots of meridional variations in (C) the assimilation number () and (D) the photosynthetic saturation irradiance (Ek), derived from least-squares regression of predicted photosynthesis-versus-irradiance curves at each station.

