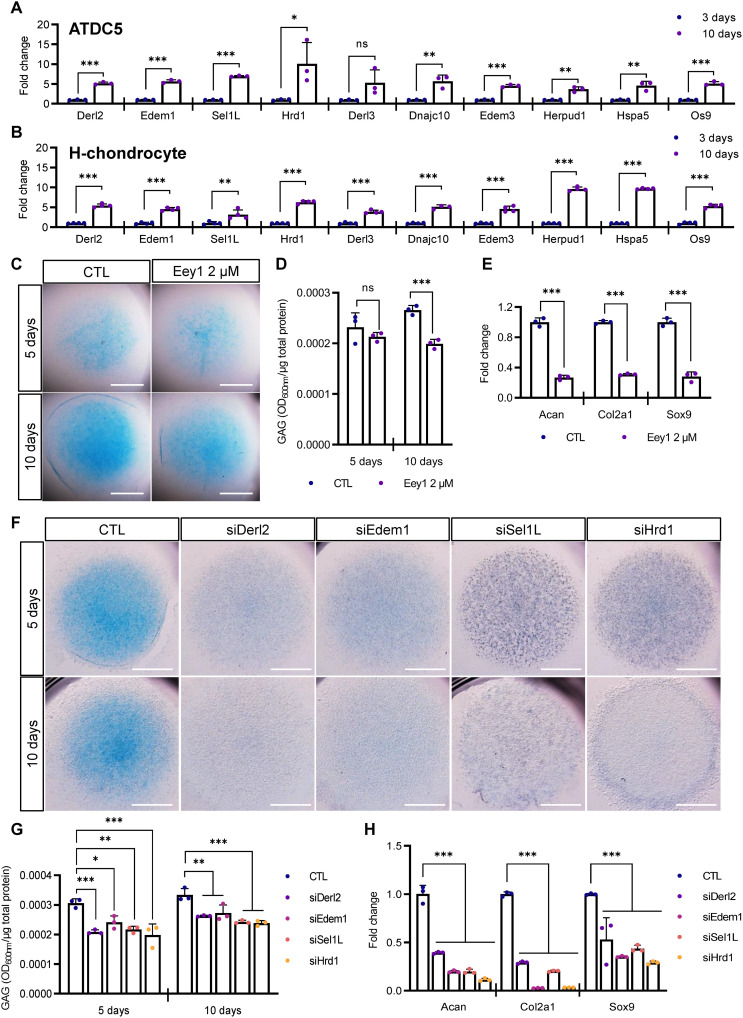
Fig. 1. ERAD genes are highly expressed in differentiating chondrocytes, and ERAD inhibition impairs chondrogenesis.
(A and B) Expression levels of ERAD genes in differentiating ATDC5 (A, n = 3) or H-chondrocyte (B, n = 4) micromasses were measured using qPCR (n = 3). ERAD gene expression was significantly increased at 10 days after induction of chondrogenesis. (C) Differentiating ATDC5 cell micromasses were treated with Eey1, and Alcian blue staining was performed at the indicated days after induction. Eey1-treated micromasses displayed sharp reductions in glycosaminoglycan (GAG) accumulation. Scale bar, 1 mm. (D) GAG levels in chondrogenic micromasses shown in (C) were measured and normalized to total protein level (n = 3). (E) Expression of cartilage anabolic factors, Acan, Col2a1, and Sox9 was measured by qPCR. Eey1 treatment significantly reduced the expression of anabolic factors (n = 3). (F) ERAD genes were depleted with siRNAs, and chondrogenesis was induced in the ATDC5 cell micromasses. Depletion of any one of the ERAD genes strongly impaired chondrogenesis. Scale bar, 1 mm. (G) GAG levels in chondrogenic micromasses shown in (F) were measured and normalized to total protein level. Depletion of any one of the ERAD genes significantly decreased GAG accumulation (n = 3). (H) Expression of cartilage anabolic factors was reduced upon depletion of any one of the ERAD genes (n = 3). Statistical analysis was performed using Student’s t test (A, B, D, and E) or one-way ANOVA (G and H). ***P < 0.001, **(0.001 < P < 0.01), *(0.01 < P < 0.05), ns (0.05 < P), OD600 = optical density at 600 nm, CTL, cytotoxic T lymphocyte.

