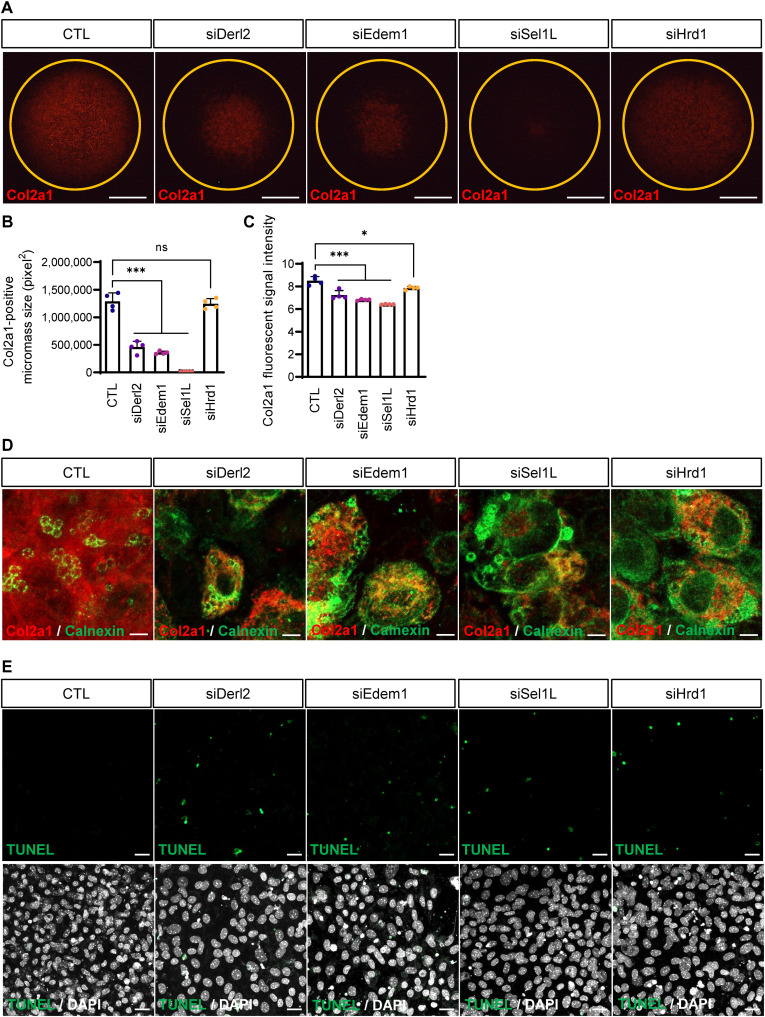
Fig. 2. Inhibition of ERAD function causes abnormal collagen accumulation in the ER lumen.
(A) Collagen deposition in chondrogenic micromasses was detected by immunofluorescence staining upon ERAD gene depletion. Depletion of ERAD genes caused severe reduction in collagen deposition compared to control micromasses. The Sel1L-depleted micromass showed a severe phenotype. Scale bar, 1 mm (B) The areas of collagen-positive micromass cultures shown in (A) were measured and plotted (n = 4). Areas of collagen positivity for Derl2- and Edem1-knockdown micromasses were significantly reduced. Sel1L depletion caused the most severe phenotypes, whereas Hrd1-depleted micromasses displayed mild reductions in collagen deposition. (C) Staining intensity of collagen-positive micromass cultures shown in (A) were measured and plotted (n = 4). Statistical analysis was performed using one-way ANOVA. ***(P < 0.001), *(0.01 < P < 0.05), ns (0.05 < P). (D) High-resolution images of micromasses shown in (A) (top). Red represents Col2a1, and green represents the ER marker calnexin. In control micromasses, collagen was secreted and deposited in the ECM. However, in ERAD-depleted micromasses, most of the collagen signal was detected in the ER lumen. Scale bars, 5 μm. (E) TUNEL staining revealed increased cell death in ERAD-depleted micromasses. The bottom panels show the merged images with DAPI staining. Scale bars, 20 μm.

