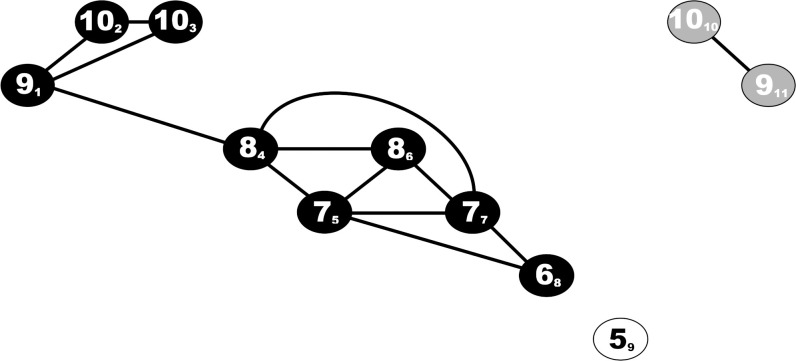
Fig 1. The similarity graph algorithm exemplified and explained within a k = 5 time series.
In this example the similarity graph algorithm transforms a time series S = (9,10,10,8,7,8,7,6,5,10,9) into a graph G, where each element of time series S corresponds to a node in V = {1,2,3,4,5,6,7,8,9,10,11}. The corresponding elements of S and nodes in V are identified as SV in the figure. Two random nodes u and v are connected by an edge in G if and only if their distance is below a certain threshold k (|u-v| < k), and the ratio of the element values below a threshold defined as max (xu, xv) / min (xu, xv) < 1.2. In this example k = 5, and edges are drawn as solid lines in the illustration. The output of the time series are 13 edges, three components (black/white/grey) two bridges (91−84, 1010−911), three missing edges between direct neighbors (103−84, 68−59 and 59−1010), one time point without edges (59), and six 3-cliques (91−102−103), (84−75−86), (84−75−77), (75−68−77), (84−86−77), (86,77,75).

