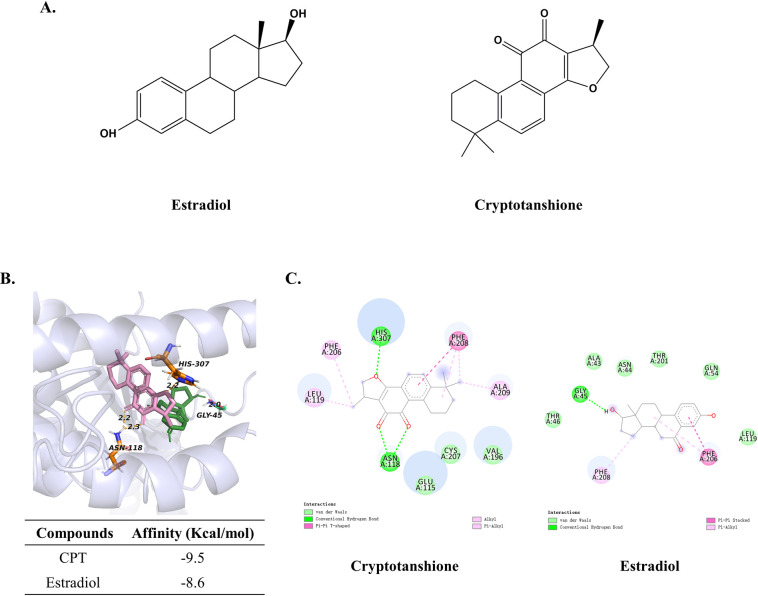
Fig 6. Molecular docking between GPER and CPT or estradiol.
(A) Chemical structure of CPT and estradiol. (B) Molecular model of estradiol and CPT docking with GPER. The protein structure is shown in purple (ribbon), CPT and estradiol are shown in pink and green carbon scheme, respectively. The yellow lines indicated the hydrogen bond between CPT and GPER, the red line indicated the hydrogen bond between estradiol and GPER. (C) Bidimensional docking results. Bubbles represent amino acid residue. Meaning of lines in different color was shown on the figures.

