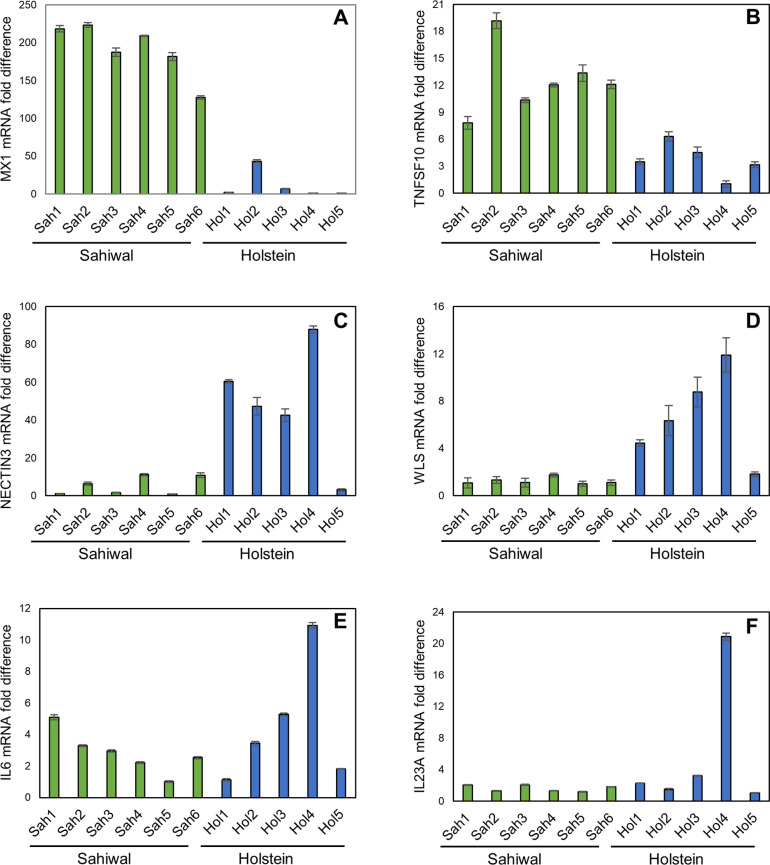
Fig 5. qRT-PCR validation of candidate H/S-DE genes.
Panels show results for representative genes. (A) MX1; (B) TNSF10; (C) NECTIN3; (D) WLS; (E) IL6; (F) IL23A. Within each panel Y axis shows mRNA fold difference (calculated vs. the lowest expressed sample); X axis designates sample number and breed; Hol1-5, Holstein; Sah1-6, Sahiwal.

