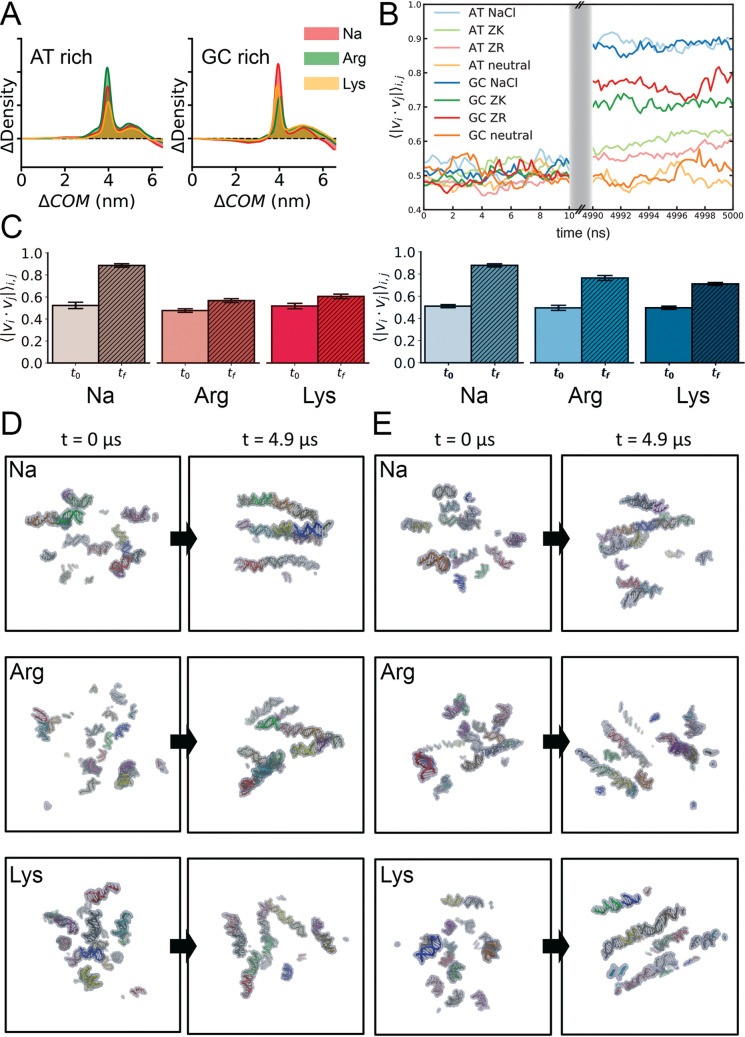
Fig 8. Structure and dynamics of large molecular systems simulated.
A) Difference between the relative Center-of-Mass (ΔCOM) displacement of the 15 DNA duplexes in each of the NaCl, ArgCl and LysCl system respect to the electroneutrality case. B) Pair-wise cross-correlation coefficient between vectors that represents the helical axe of each DNA duplex along the total simulated time. First and last 10 ns are shown. C) Pair-wise cross-correlation coefficient between helical axes of each DNA duplex for AT-rich (red-ish series) vs GC-rich (blue-ish series). D) Initial and one representative “final” structure obtained from the corresponding MD trajectories of AT-rich systems. Each duplex is depicted in cartoon representation using different colours. E) Same as (D) for GC-rich system simulated.

