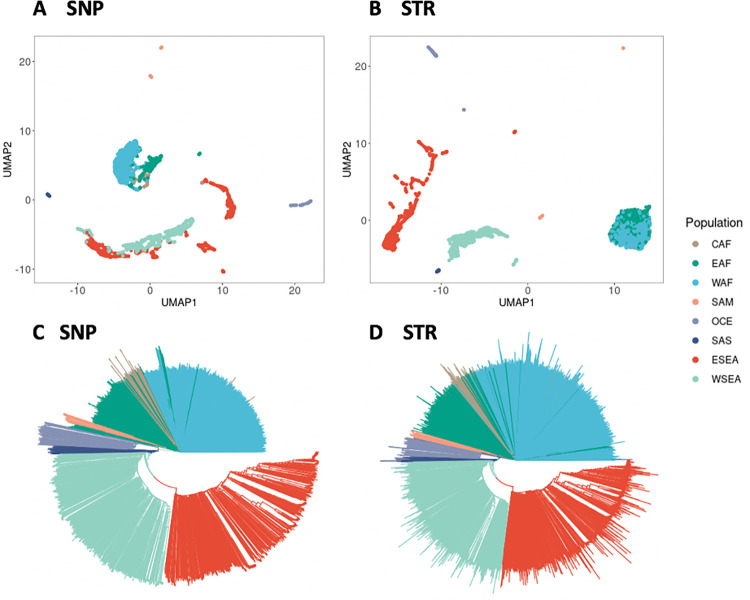
Fig 3. Population structure analysis of the 3,047 P. falciparum samples of SNP and STR data.
(A) UMAP clustering of the top five principal components of the SNP data, colours representing the eight different populations. (B) UMAP clustering of the top five principal components of the STR data. (C) Neighbor joining tree based on the SNP data. (D) Neighbor joining tree based on the STR data. Branches are colored according to the population.

