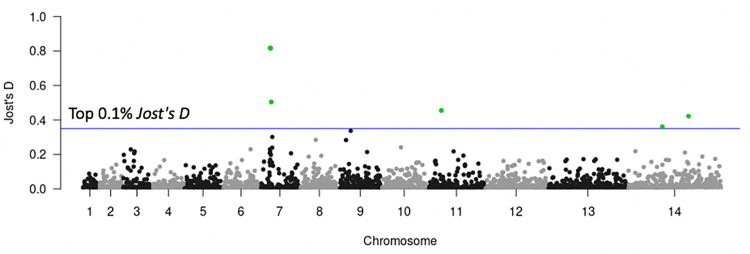
Fig 7. Genome scans for differentiation for chloroquine drug resistance using 57 EAF drug-resistant and 269 EAF drug-sensitive samples.
The x-axis represents the chromosomes, and the y-axis represents the Jost’s D values. Each point represents one STR locus. The blue horizontal line represents the top 0.1% Jost’s D values.

