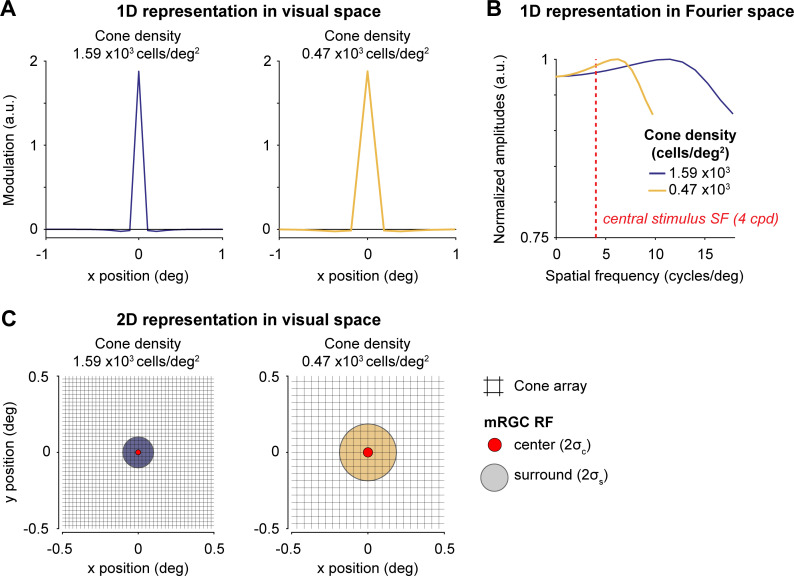
Fig 4. Difference of Gaussians filters used to model mRGC layer.
Two mRGCs are illustrated for a 2x2° field-of-view mRGC array centered at 4.5° and 40° eccentricity. (A) 1D representation of two example mRGC layers in visual space. The mRGC responses are computed by convolving the cone image with the mRGC DoG RF, followed by adding noise, and subsampling the cone array to the corresponding mRGC density. Width for Gaussian center (σc) and surround (σs) are converted to units of degree. As the mRGC filters in our model are not rectified, they respond to both increments and decrements. Physiologically, this would require two cells (an ON and OFF cell), so we count each modeled mRGC location as two cells. Both panels show a mRGC:cone ratio of 2:1. (B) 1D representation of Difference of Gaussians in Fourier space. The Fourier representation illustrates the band-pass and unbalanced nature of the DoG (i.e., non-zero amplitude at DC). Depending on the width/subsample rate, DoGs attenuate different spatial frequencies. However, at our peak stimulus frequency (4 cycles per degree, indicated with red dashed line) the two DoG filters vary a relatively small amount, preserving most stimulus information. Fourier amplitudes are normalized. Note that y-axis is truncated for illustration purposes. (C) 2D representation of two example mRGC layers shown in panel. Midget RGC DoG filters are zoomed into a 1x1° field-of-view cone array (black raster) centered at 4.5° (red center with purple surround) and 40° eccentricity (red center with yellow surround), corresponding to the 1D examples in panel A. Centers and surrounds are plotted at 2 standard deviations. For illustration purposes, only one mRGC is shown; the mRGC array in our computational observer model tiles the entire cone array.

