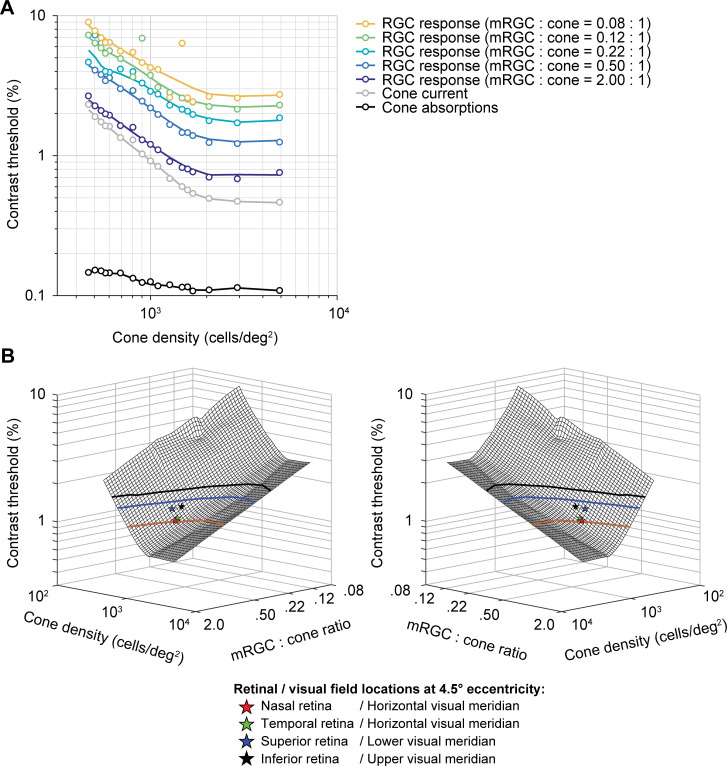
Fig 6. The effect of spatial filtering properties by mRGCs on full model performance.
(A) Contrast thresholds as a function of cone density and mRGC:cone ratio. Data points are contrast thresholds for cone absorptions, cone photocurrent, and each mRGC:cone ratio separately (for psychometric functions see S3 Fig). Individual mRGC fits are slices of the 3D mesh fit shown in panel B. (B) Mirrored views of combined effect of cone density and mRGC:cone ratio on contrast sensitivity. The mesh is fitted with a locally weighted regression to 3D data: log cone density (x-axis) by log mRGC:cone ratio (y-axis) by log contrast thresholds (z-axis). Individual dots represent the predicted model performance for nasal retina or horizontal visual (red star), superior retina or lower visual (blue star), temporal retina or horizontal visual (green star) and inferior or upper visual (black star) meridian locations at 4.5° eccentricity (matched to stimulus eccentricity in [15]). Contour lines show possible cone densities and mRGC:cone ratios that would predict the same horizontal-vertical and upper/lower vertical-meridian asymmetry as observed in psychophysical data at 4.5° eccentricity. To do so, we scaled the difference in contrast threshold between the lower (blue) and upper (black) vertical visual meridian relative to the horizontal meridian to match the difference in behavior. Goodness of fit of 3D mesh fit is R2 = 0.96.

