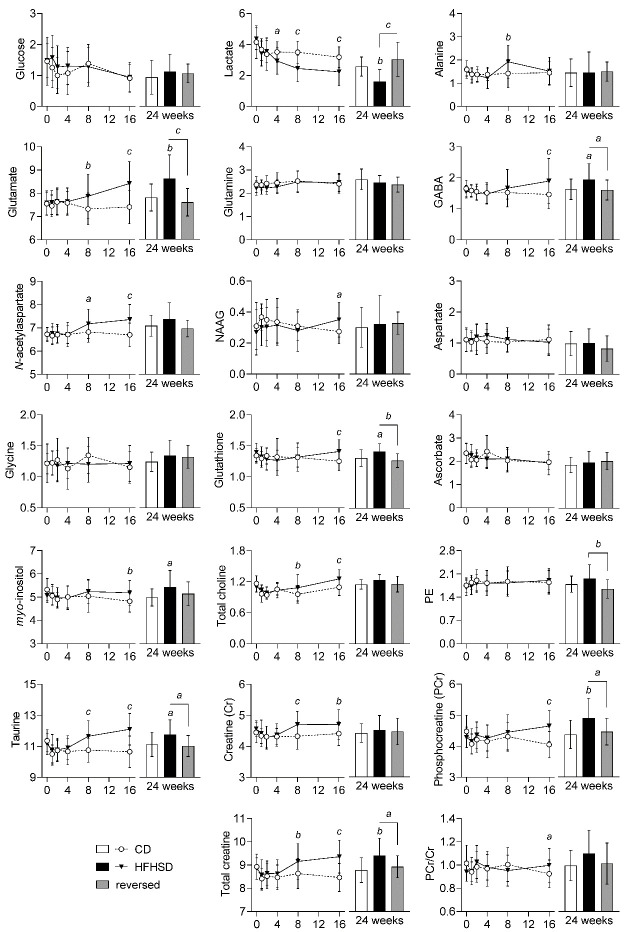
Figure 5.
Alterations in metabolite concentrations (in µmol/g) triggered by HFHSD feeding in the hippocampus. Data is mean ± SD. Letters over data-points indicate significant differences relative to CD or as indicated (a P<0.05, b P<0.01, c P<0.001) based on Fisher’s LSD post hoc comparison following presence of significant effects of diet or interaction between diet and time in ANOVA tests.

