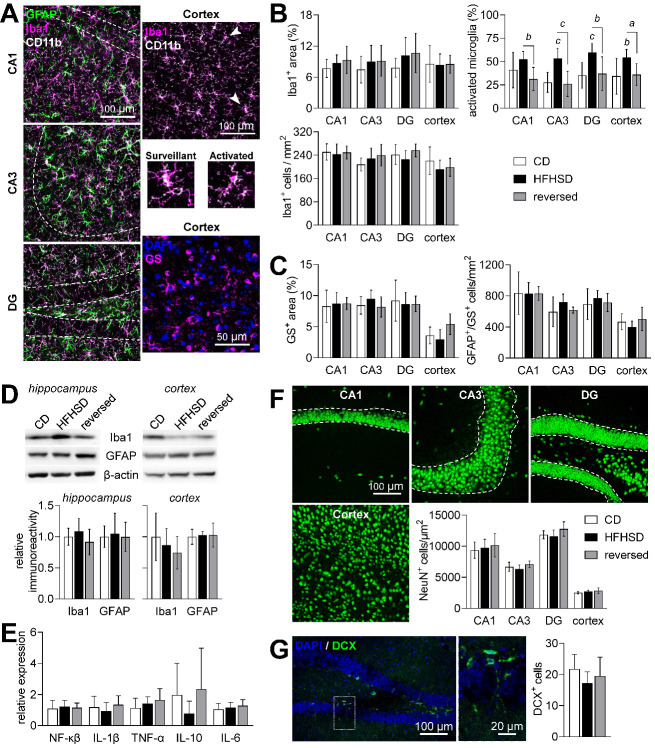
Figure 8.
Neuroinflammation and neurodegeneration analysis in the hippocampus and cortex. (A) Confocal micrographs depicting Iba1-, CD11b- and GFAP-immunolabeled cells in the cornus amonis CA1/CA3 and dentate gyrus (DG) of the hippocampus or in the cortex, and cortical immunolabeling of glutamine synthetase (GS). Typical surveillant and activated microglia (Iba1+ and CD11b+) phenotypes are indicated by the arrowheads, and expanded below the cortex micrograph. (B) HFHSD had no impact on the Iba1+ area or number of microglia cells, but increased the fraction of activated microglia, which was normalized by diet reversal. (C) Astrocytes were considered all GS+ and/or GFAP+ cells. HFHSD had no impact on the area occupied by GS+ cells or number of astrocytes. (D) Total Iba1 and GFAP levels in the hippocampus or cortex were similar across the experimental groups. (E) Expression of NF-κβ and cytokines in the hippocampus, relative to the 60S ribosomal protein L14. (F) NeuN immunolabeling of neuronal somata was used to estimate the number of mature neurons in the cortex and within the granule cell layer of CA1, CA3 and DG. (G) Doublecortin (DCX)-immunolabeling was used to count immature neurons. DCX+ cells are estimated per DG within a stained brain slice. Dashed lines in micrographs define the granule cell layer in CA1, CA3 and DG. Data is plotted as mean±SD of n=6-8 (half of either gender). Letters over data-points indicate significant differences relative to CD or as indicated (a P<0.05, b P<0.01, c P<0.001) based on Fisher’s LSD post hoc comparison following presence of significant effects of diet or interaction between diet and time in ANOVA tests.

