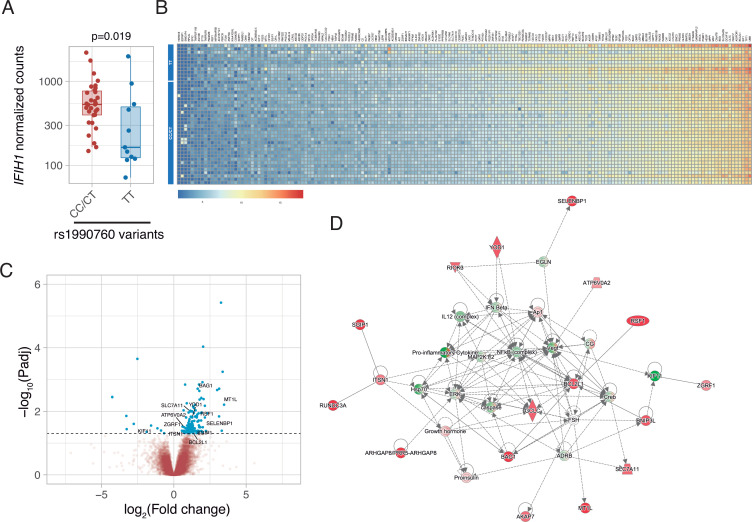
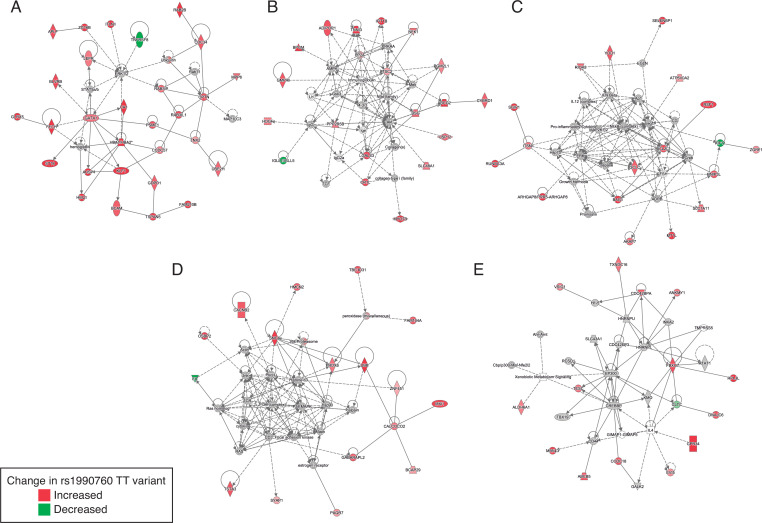
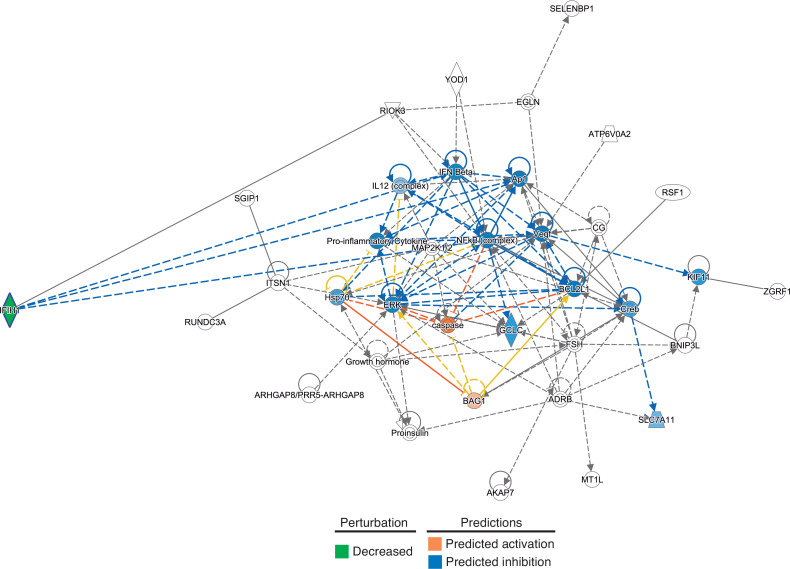
Figure 2. Differences in gene expression according to IFIH1 rs1990760 genotypes.
(A) Expression of IFIH1 in peripheral blood in patients with CC/CT (n=31) and TT (n=11) variants (p-value calculated using a Wilcoxon test). (B) Heatmap showing expression of the 160 genes with significant differences between variants. (C) Volcano plot showing the distribution of the magnitude of the differences in gene expression (Log2 Fold change) and their statistical significance. Inflammation-related genes with differential expression and included in the network shown in panel (D) are labeled. (D) Inflammation-related gene network identified using Ingenuity Pathway Analysis on the RNAseq data. Points represent individual patient data. In boxplots, bold line represents the median, lower and upper hinges correspond to the first and third quartiles (25th and 75th percentiles) and upper and lower whiskers extend from the hinge to the largest or smallest value no further than 1.5 times the interquartile range.
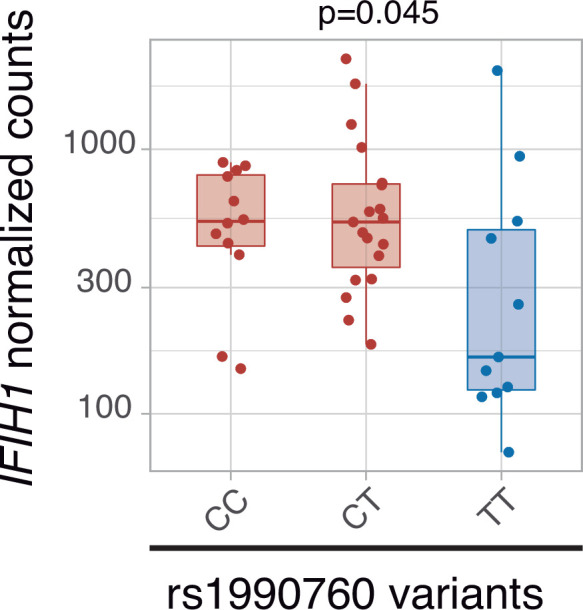
Figure 2—figure supplement 1. IFIH1 expression per rs1990760 variants.


