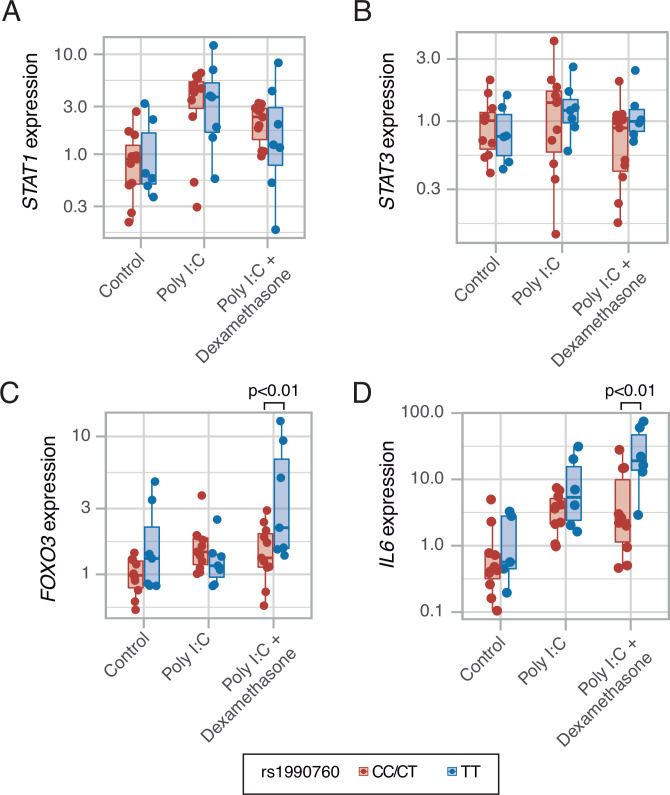
Figure 5. Expression of transcription factors STAT1 (A, p=0.012, no significant differences between variants in post hoc tests), STAT3 (B, p=0.443) and FOXO3 (C, p=0.002), and cytokine IL6 (D, p<0.001) induced by MDA5 activation using high molecular weight poly-I:C (a viral RNA analog) and dexamethasone in peripheral mononuclear blood cells.
Results were fitted using a mixed-effects linear model including cell donor as a fixed effect and experimental group and genotype as random effects. Pairwise p-values lower than 0.05 (using Holm’s correction) are shown. Points represent individual patient data. In boxplots, bold line represents the median, lower and upper hinges correspond to the first and third quartiles (the 25th and 75th percentiles) and upper and lower whiskers extend from the hinge to the largest or smallest value no further than 1.5 times the interquartile range.


