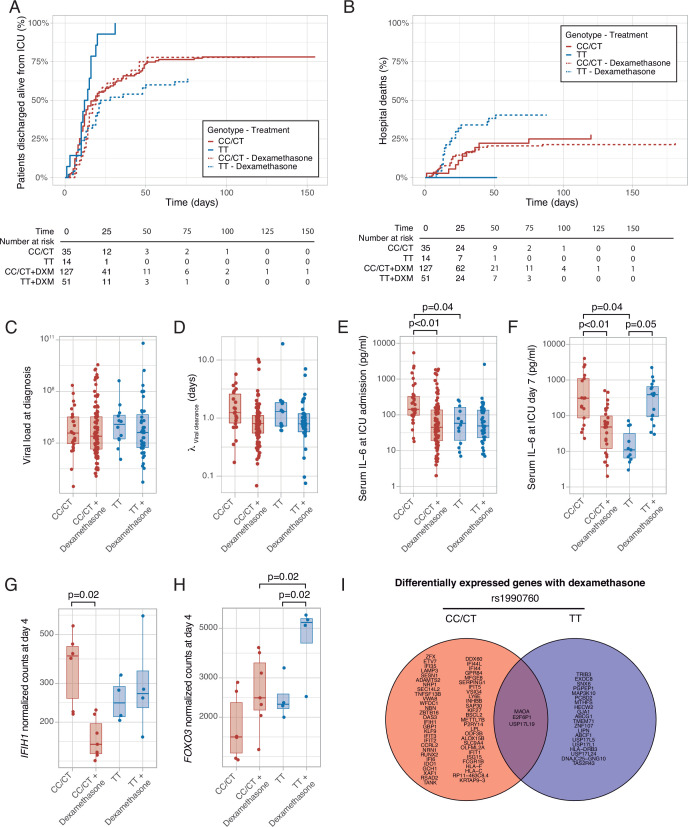
Figure 6. Outcomes according to IFIH1 rs1990760 variants and treatment with dexamethasone.
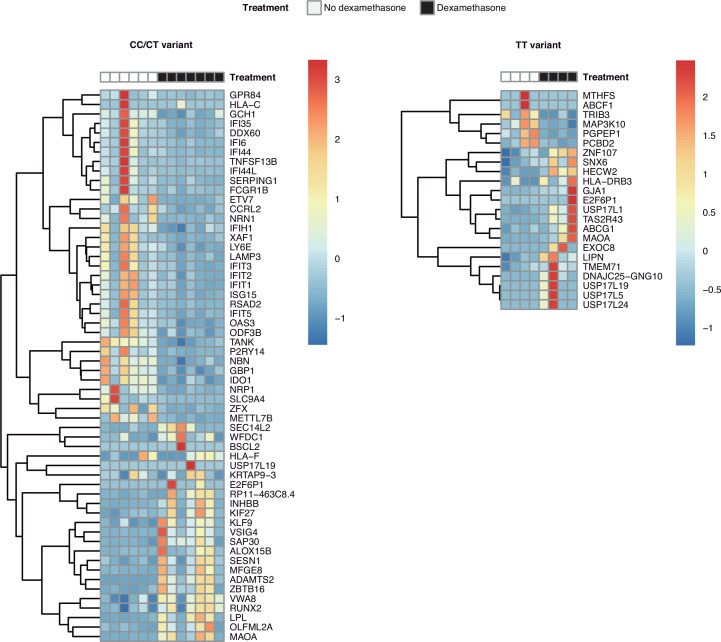
(A) Cumulative incidence of ICU discharge alive and spontaneously breathing for each group. (B) Cumulative incidence of hospital death for each group. Outcomes were modeled as competing events. (C) Viral load at diagnosis for each group (p=0.888). (D) Viral clearance evaluated as half-life of an exponential decay function calculated from the maximal viral load in each patient (p=0.056, no significant differences in post hoc tests). (E, F) Serum IL-6 concentrations during the first day (E, p<0.001) and 7 days (F, p=0.014) after ICU admission for each group. Differences among groups in panels (C–F) were evaluated using an analysis of the variance. Pairwise p-values lower than 0.05 (using Holm’s correction) are shown. (G, H) Changes in IFIH1 (G) and FOXO3 (H) expression in day 4 of ICU stay for each group (n=6 and 7 for CC/CT variants without and with dexamethasone, respectively, n = 4 and 4 for TT variant without and with dexamethasone, respectively). (I) Genes with dexamethasone-induced changes in gene expression in ICU day four in each rs1990760 variant. Points represent individual patient data. In boxplots, bold line represents the median, lower and upper hinges correspond to the first and third quartiles (25th and 75th percentiles) and upper and lower whiskers extend from the hinge to the largest or smallest value no further than 1.5 times the interquartile range.


