. 2022 Jan 21;11:e70393. doi: 10.7554/eLife.70393

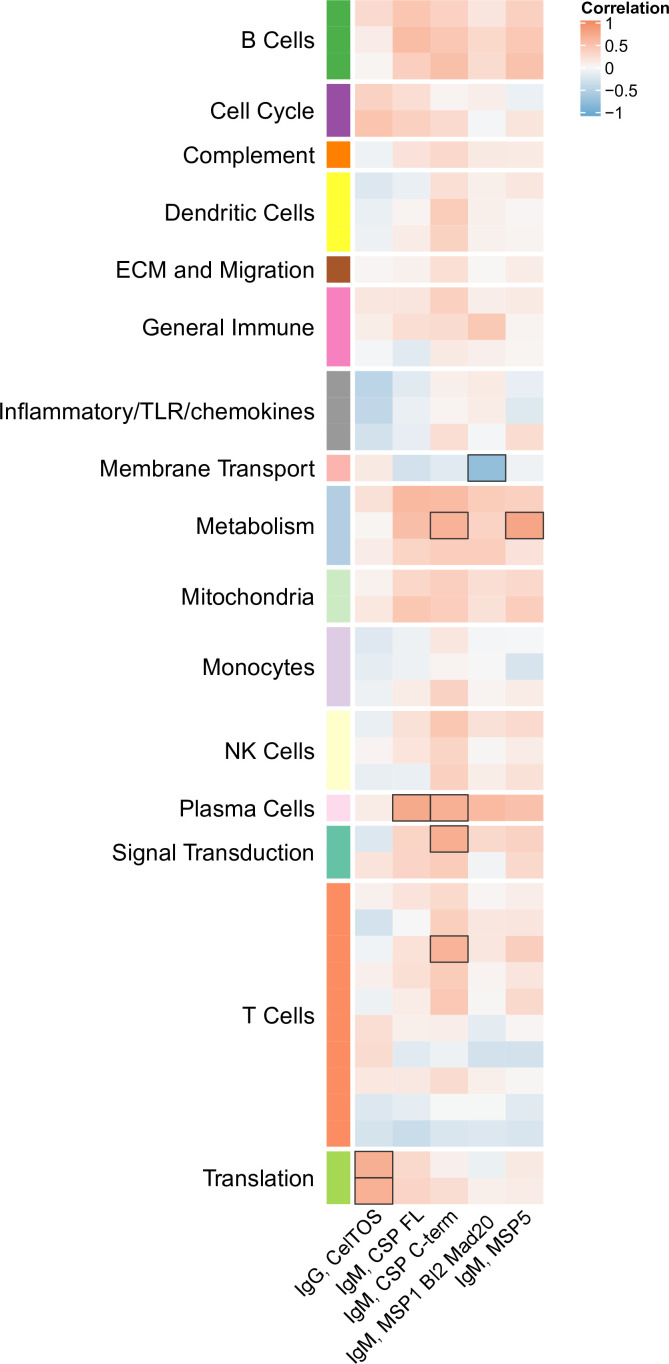
Figure 5. Correlations of month 3 transcriptional and adaptive responses in RTS,S/AS01 vaccine recipients.

Heatmap showing correlations between month 3 levels of RTS,S/AS01 signature blood transcriptional modules (BTMs) in vehicle-treated peripheral blood mononuclear cells (PBMC) and month 3 antibody responses. Cell color intensity represents the strength of the correlation; BTM/response pairs with significant correlations (false discovery rate [FDR] ≤0.2) are outlined in black. Cell color represents correlation direction: red, positive correlation; blue, negative correlation. High-level BTM annotation groups are shown in the left-most color bar. Number of participants: 30–42.

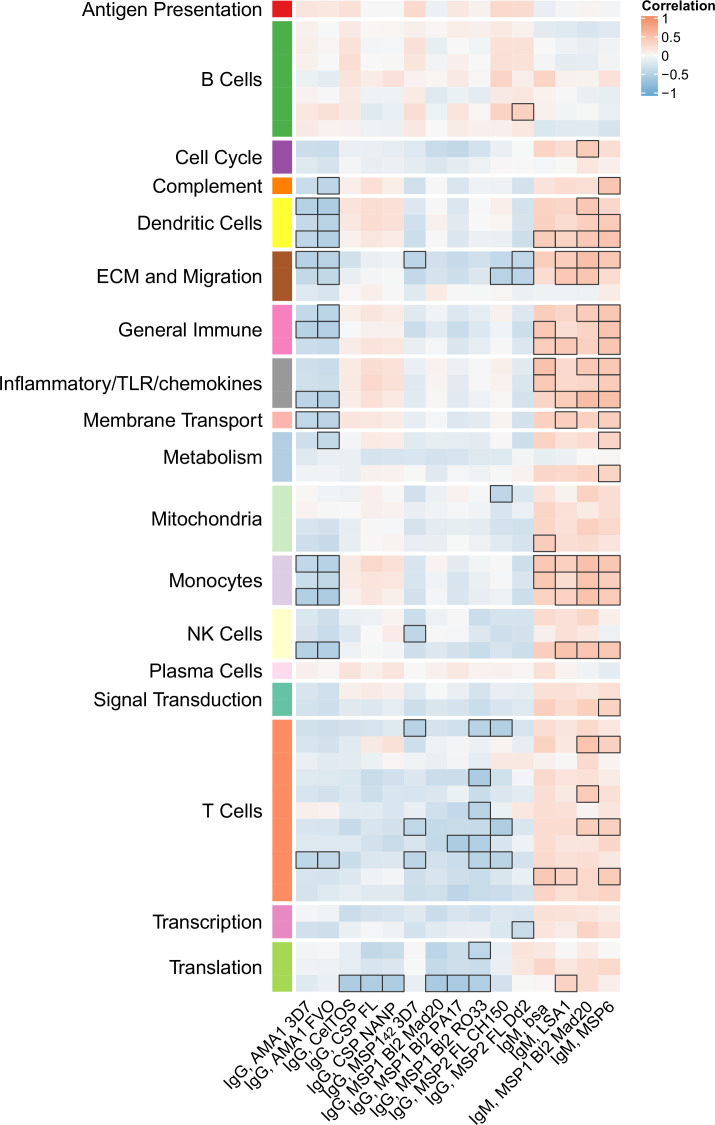
Figure 5—source data 1. List of blood transcriptional modules (BTMs) whose month 3 levels in vehicle-treated peripheral blood mononuclear cells (PBMC) correlated significantly with at least one month 3 adaptive response variable in RTS,S/AS01 vaccinees, along with variable details, p value, and false discovery rate (FDR) results.

Figure 5.

Figure 5—figure supplement 1. Correlations of transcriptional and adaptive responses in comparator vaccine recipients.

Figure 5—figure supplement 1.

Heatmap showing significant correlations between month 3 levels of RTS,S/AS01 signature blood transcriptional modules (BTMs) in vehicle-treated peripheral blood mononuclear cells (PBMC) and month 3 antibody responses in comparator recipients. Cell color intensity represents the strength of the correlation; BTM/response pairs with significant correlations (false discovery rate [FDR] ≤0.2) are outlined in black. Cell color represents correlation direction: red, positive correlation; blue, negative correlation. High-level BTM annotation groups are shown in the left-most color bar. No correlations with month 3 cellular responses were seen.
Figure 5—figure supplement 1—source data 1. List of blood transcriptional modules (BTMs) whose month 3 levels in vehicle-treated peripheral blood mononuclear cells (PBMC) correlated significantly with at least one month 3 adaptive response variable in comparator recipients, along with variable details, p value, and false discovery rate (FDR) results.