. 2022 Jan 21;11:e70393. doi: 10.7554/eLife.70393

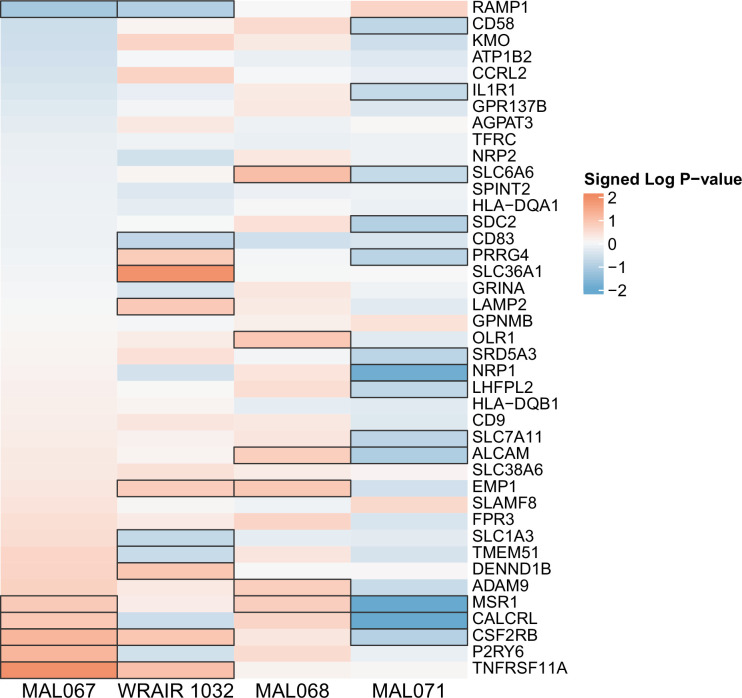
Figure 6. Associations of (A) month 3 or (B) month 0 levels of downselected blood transcriptional modules (BTMs) with malaria case status RTS,S/AS01 vaccine recipients across studies sharing a common months 0, 1, and 2 RTS,S/AS01 arm.

(A) Heatmap showing the difference in month 3 peripheral blood mononuclear cell (PBMC) BTM expression between RTS,S/AS01 cases vs. controls, in each of three controlled human malaria infection (CHMI) studies, of the seven BTMs whose month 3 levels in vehicle-stimulated PBMC associated with malaria case status in MAL067 (Figure 3). ‘Month 3’ = 21-day postfinal dose in MAL068 and MAL071, and 14-day postfinal dose in WRAIR 1032. BTMs with significantly different expression (false discovery rate [FDR] ≤0.2, with adjustment done across the five BTMs) are outlined in black. |FDR| < 0.2 (*), <0.05 (**), <0.01 (***). (B) Heatmap showing the 45 BTMs whose month 0 levels showed significantly different expression in MAL067 RTS,S/AS01 malaria cases vs. nonmalaria controls. These 45 BTMs were also examined as potential correlates of challenge outcome in each of the 3 CHMI studies. Significantly different expression is defined as FDR ≤0.2, with adjustment across the 45 BTMs. All data shown are from participants who received the same vaccine regimen: a dose of RTS,S/AS01 at months 0, 1, and 2. Cell color intensity represents the significance of the difference in the case vs. control comparison, expressed as signed log10 FDR; BTMs with significantly different expression (FDR ≤0.2) between the two compared groups are outlined in black. |FDR| < 0.2 (*), <0.05 (**), <0.01 (***). Red, higher expression in RTS,S/AS01 cases vs. controls; blue, lower expression in RTS,S/AS01 cases vs. controls. High-level BTM annotation groups are shown in the left-most color bar. Numbers of participants in each analysis are: (A) MAL067, 122; WRAIR 1032, 39; MAL068 RRR, 21; MAL071 RRR, 16. (B) MAL067, 37; WRAIR 1032, 39; MAL068 RRR, 21; MAL071 RRR, 16. Detailed equations are given in Methods.

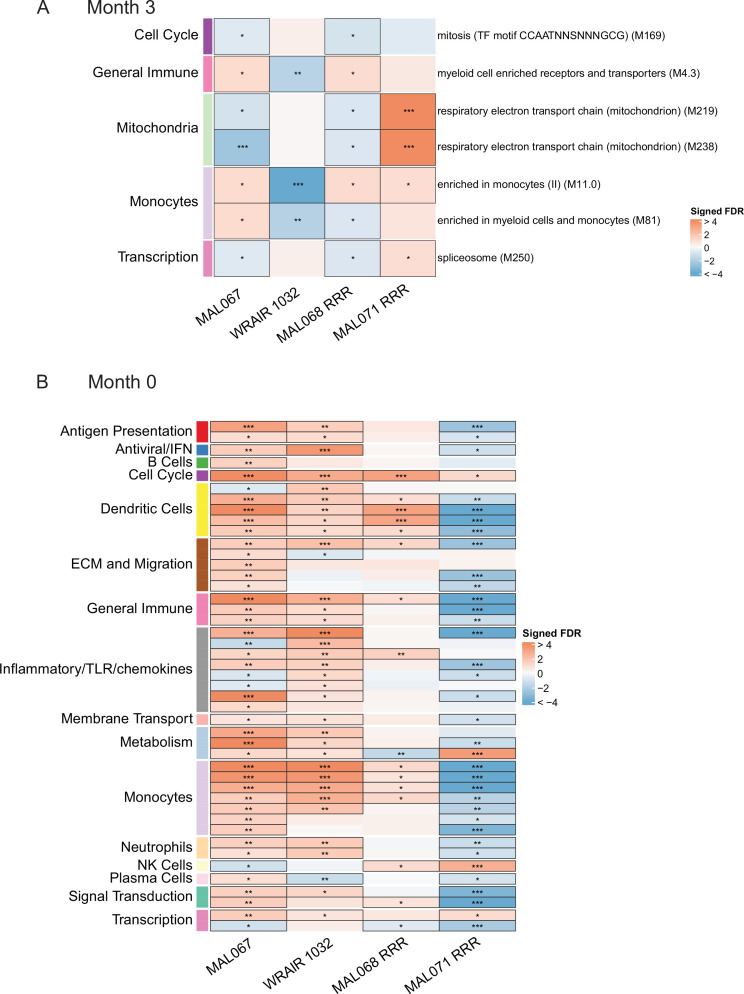
Figure 6—source data 1. List of the seven blood transcriptional modules (BTMs) whose month 3 levels had significantly different expression in RTS,S/AS01 cases vs. controls in MAL067, along with p values and false discovery rate (FDR) results when testing these seven BTMs for significantly different expression in cases vs. controls in the WRAIR 1032, MAL068 RRR, and MAL071 RRR studies.
Figure 6—source data 2. List of the 45 blood transcriptional modules (BTMs) whose month 0 levels had significantly different expression in RTS,S/AS01 cases vs. controls in MAL067, along with p values and false discovery rate (FDR) results when testing these 45 BTMs for significantly different expression in cases vs. controls in the WRAIR 1032, MAL068 RRR, and MAL071 RRR studies.

Figure 6.

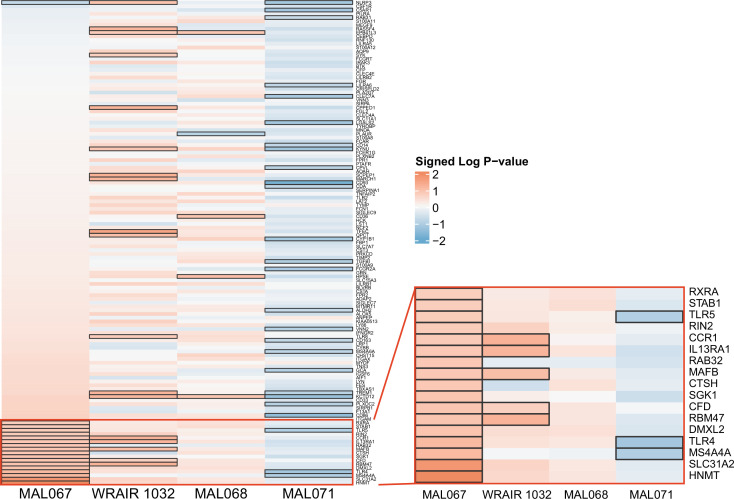
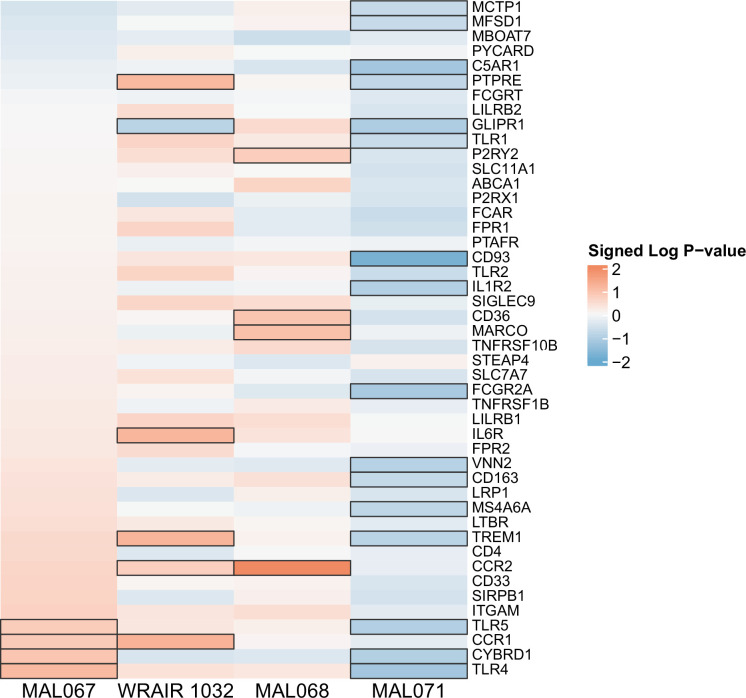
Figure 6—figure supplement 1. Association of month 0 level of each gene in the ‘cell cycle and transcription (M4.0)’ module with malaria case status across studies sharing a common months 0, 1, and 2 RTS,S/AS01 arm.

Figure 6—figure supplement 1.

Cell color intensity represents the strength of the difference in the case vs. control comparison, expressed as signed log10 p value; genes with significantly different expression (false discovery rate ≤0.2) between the two compared groups are outlined in black. Red, higher expression in RTS,S/AS01 cases vs. controls; blue, lower expression in RTS,S/AS01 cases vs. controls. The red-outlined portion of the heatmap in the lower right corresponds to an expanded view of the red-outlined portion of the heatmap on the left, for increased legibility of gene names.
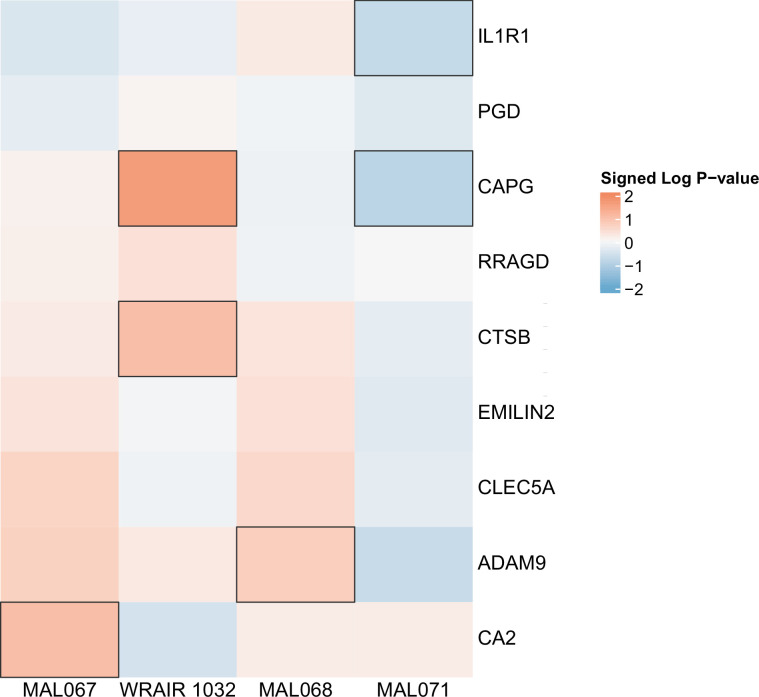
Figure 6—figure supplement 2. Association of month 0 level of each gene in the ‘Resting dendritic cell surface signature (S10)’ module with malaria case status across studies sharing a common months 0, 1, and 2 RTS,S/AS01 arm.

Figure 6—figure supplement 2.

Cell color intensity represents the strength of the difference in the case vs. control comparison, expressed as signed log10 p value; genes with significantly different expression (false discovery rate ≤0.2) between the two compared groups are outlined in black. Red, higher expression in RTS,S/AS01 cases vs. controls; blue, lower expression in RTS,S/AS01 cases vs. controls.
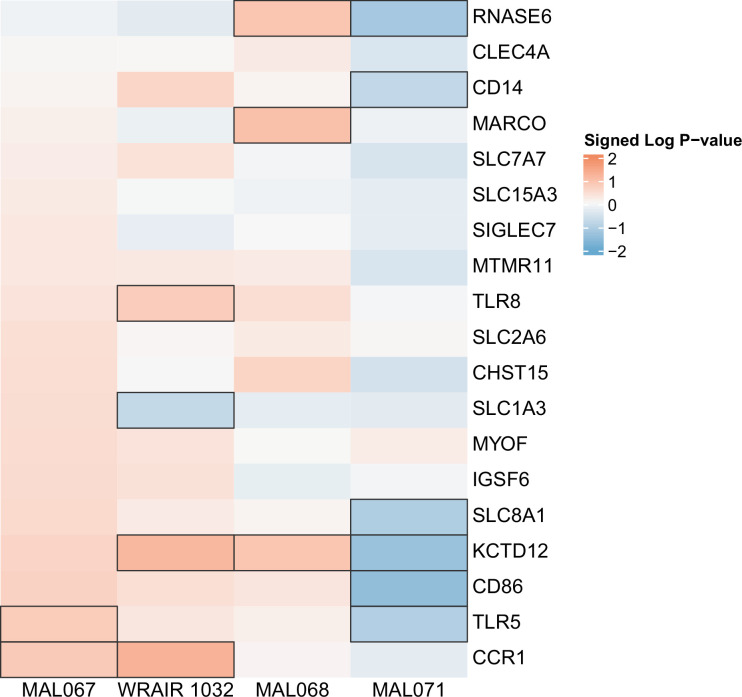
Figure 6—figure supplement 3. Association of month 0 level of each gene in the ‘DC surface signature (S5)’ module with malaria case status across studies sharing a common months 0, 1, and 2 RTS,S/AS01 arm.

Figure 6—figure supplement 3.

Cell color intensity represents the strength of the difference in the case vs. control comparison, expressed as signed log10 p value; genes with significantly different expression (false discovery rate ≤0.2) between the two compared groups are outlined in black. Red, higher expression in RTS,S/AS01 cases vs. controls; blue, lower expression in RTS,S/AS01 cases vs. controls.
Figure 6—figure supplement 4. Association of month 0 level of each gene in the ‘Enriched in dendritic cells (M168)’ module with malaria case status across studies sharing a common months 0, 1, and 2 RTS,S/AS01 arm.

Figure 6—figure supplement 4.

Cell color intensity represents the strength of the difference in the case vs. control comparison, expressed as signed log10 p value; genes with significantly different expression (false discovery rate ≤0.2) between the two compared groups are outlined in black. Red, higher expression in RTS,S/AS01 cases vs. controls; blue, lower expression in RTS,S/AS01 cases vs. controls.
Figure 6—figure supplement 5. Association of month 0 level of each gene in the ‘Myeloid cell enriched receptors and transporters (M4.3)’ module with malaria case status across studies sharing a common months 0, 1, and 2 RTS,S/AS01 arm.

Figure 6—figure supplement 5.

Cell color intensity represents the strength of the difference in the case vs. control comparison, expressed as signed log10 p value; genes with significantly different expression (false discovery rate ≤0.2) between the two compared groups are outlined in black. Red, higher expression in RTS,S/AS01 cases vs. controls; blue, lower expression in RTS,S/AS01 cases vs. controls.
Figure 6—figure supplement 6. Association of month 0 level of each gene in the ‘Enriched in monocytes (II) (M11.0)’ module with malaria case status across studies sharing a common months 0, 1, and 2 RTS,S/AS01 arm.

Figure 6—figure supplement 6.

Cell color intensity represents the strength of the difference in the case vs. control comparison, expressed as signed log10 p value; genes with significantly different expression (false discovery rate ≤0.2) between the two compared groups are outlined in black. Red, higher expression in RTS,S/AS01 cases vs. controls; blue, lower expression in RTS,S/AS01 cases vs. controls.
Figure 6—figure supplement 7. Association of month 0 level of each gene in the ‘Enriched in monocytes (I) (M4.15)’ module with malaria case status across studies sharing a common months 0, 1, and 2 RTS,S/AS01 arm.

Figure 6—figure supplement 7.

Cell color intensity represents the strength of the difference in the case vs. control comparison, expressed as signed log10 p value; genes with significantly different expression (false discovery rate ≤0.2) between the two compared groups are outlined in black. Red, higher expression in RTS,S/AS01 cases vs. controls; blue, lower expression in RTS,S/AS01 cases vs. controls.
Figure 6—figure supplement 8. Association of month 0 level of each gene in the ‘Monocyte surface signature (S4)’ module with malaria case status across studies sharing a common months 0, 1, and 2 RTS,S/AS01 arm.

Figure 6—figure supplement 8.

Cell color intensity represents the strength of the difference in the case vs. control comparison, expressed as signed log10 p value; genes with significantly different expression (false discovery rate ≤0.2) between the two compared groups are outlined in black. Red, higher expression in RTS,S/AS01 cases vs. controls; blue, lower expression in RTS,S/AS01 cases vs. controls.
Figure 6—figure supplement 9. Correlations of month 0 blood transcriptional module (BTM) expression in vehicle-treated peripheral blood mononuclear cells (PBMC) with month 3 T-cell responses in RTS,S/AS01 vaccine recipients.

Figure 6—figure supplement 9.

Heatmap showing significant correlations between month 0 levels of RTS,S/AS01 signature BTMs and month 3 cellular responses (no significant correlations were seen with any month 3 antibody responses). Cell color intensity represents the strength of the correlation; BTM/response pairs with significant correlations (false discovery rate [FDR] ≤0.2) are outlined in black. Cell color represents correlation direction: red, positive correlation; blue, negative correlation. High-level BTM annotation groups are shown in the left-most color bar. No significant correlations were seen with month 3 antibody responses. PFS, polyfunctionality score.
Figure 6—figure supplement 9—source data 1. List of blood transcriptional modules (BTMs) whose month 0 levels correlated significantly with at least one month 3 adaptive response variable, along with stimulation, variable details, p value, and false discovery rate (FDR) results.
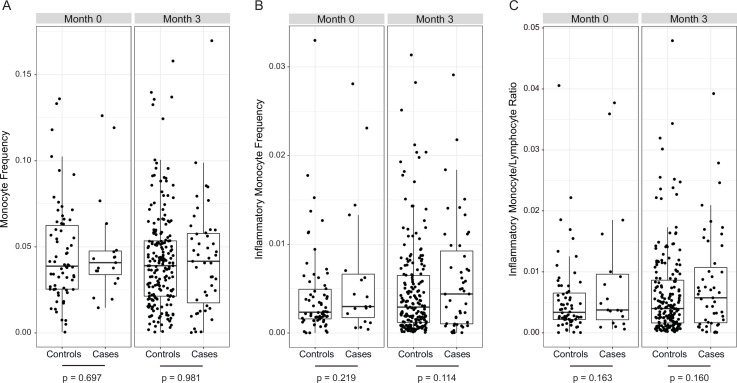
Figure 6—figure supplement 10. No significant differences in monocyte frequencies in cases vs. controls in RTS,S/AS01 vaccinees at either month 0 or 3.

Figure 6—figure supplement 10.

(A) Monocyte frequency, (B) inflammatory monocyte frequency, and (C) inflammatory monocyte/lymphocyte ratio, stratified by case/control status, in RTS,S/AS01 recipients. Flow cytometry data were analyzed using the gating strategy defined in Moncunill et al., 2017a. ‘Inflammatory monocytes’ refers to ‘HLA-DR+ CD14+ CD16++’ cells. The p values at the bottom of each panel are from testing for a significant difference in controls vs. cases within each panel, and were modeled using a mixed-effects model (using lmer) with match ID as a random effect.