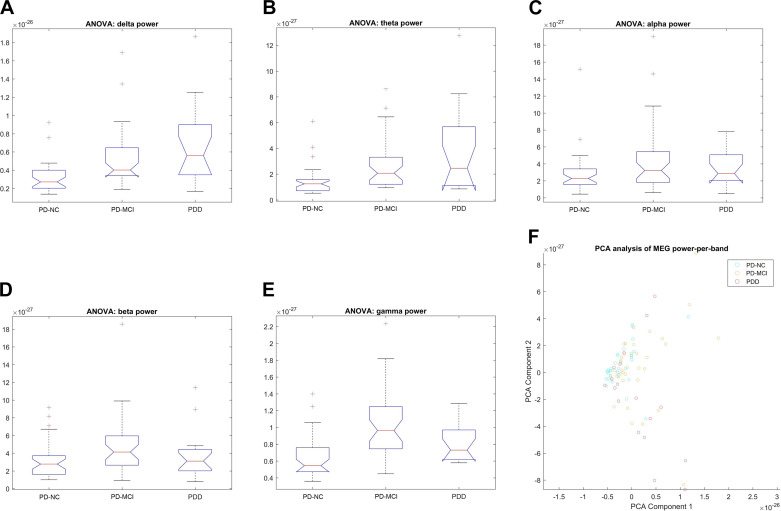
Figure 1.
Whole brain power difference between cognitive classes. ANOVA plots show power in the low‐frequency bands [delta (A), theta (B)] increased from cognitively normal Parkinson’s disease (PD) (PD‐NC) to PD‐mild cognitive impairment (MCI) and also from PD‐MCI to PD dementia (PDD), whereas power for the high-frequency bands [beta (D), gamma (E)] increases from PD‐NC to PD‐MCI but decreases from PD‐MCI to PDD. No change was observed in the alpha band (C). F: eigenvector plot showing a wedge-shaped overall distribution, with PD-NC datasets tightly clustered around the apex of the wedge, whereas PD-MCI cases are mostly distributed above and to the right of that spot, and PDD cases are mostly found below and to the right of the spot. MEG, magnetoencephalography.

