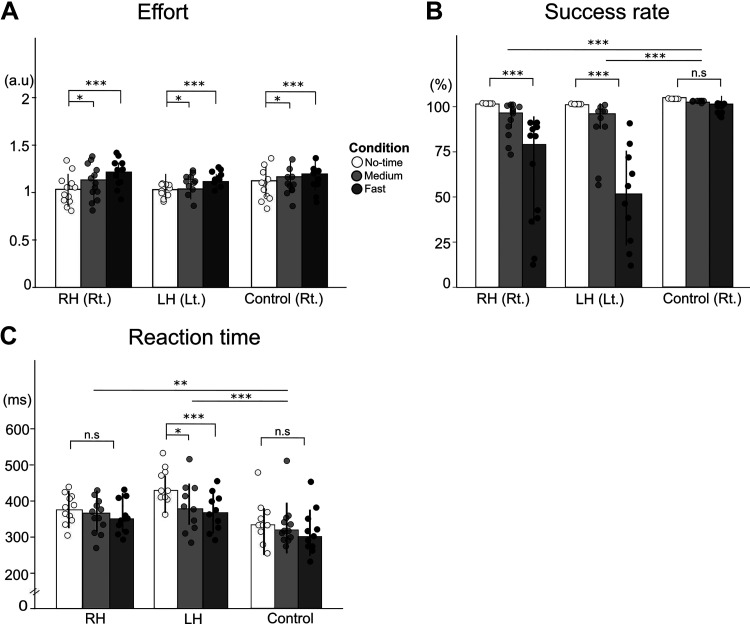
Figure 3.
Effort and success of the paretic arm and choice reaction times in RH, LH, and control groups. A and B: effort and success rates measured in the forced choice blocks of the paretic arm for RH and LH groups (and the right arm for control group) in the no-time (white), medium- (light gray), and fast- (dark gray) time constraint conditions. Dots indicate each individual. C: reaction times measured in the spontaneous choice blocks across the time-constraint conditions for all groups. a.u., arbitrary unit; LH, left hemiparesis; Lt., Left arm; n.s., not significant; RH, right hemiparesis; Rt., right arm; *P < 0.05, **P < 0.01, ***P < 0.001. Error bars show standard deviations.

