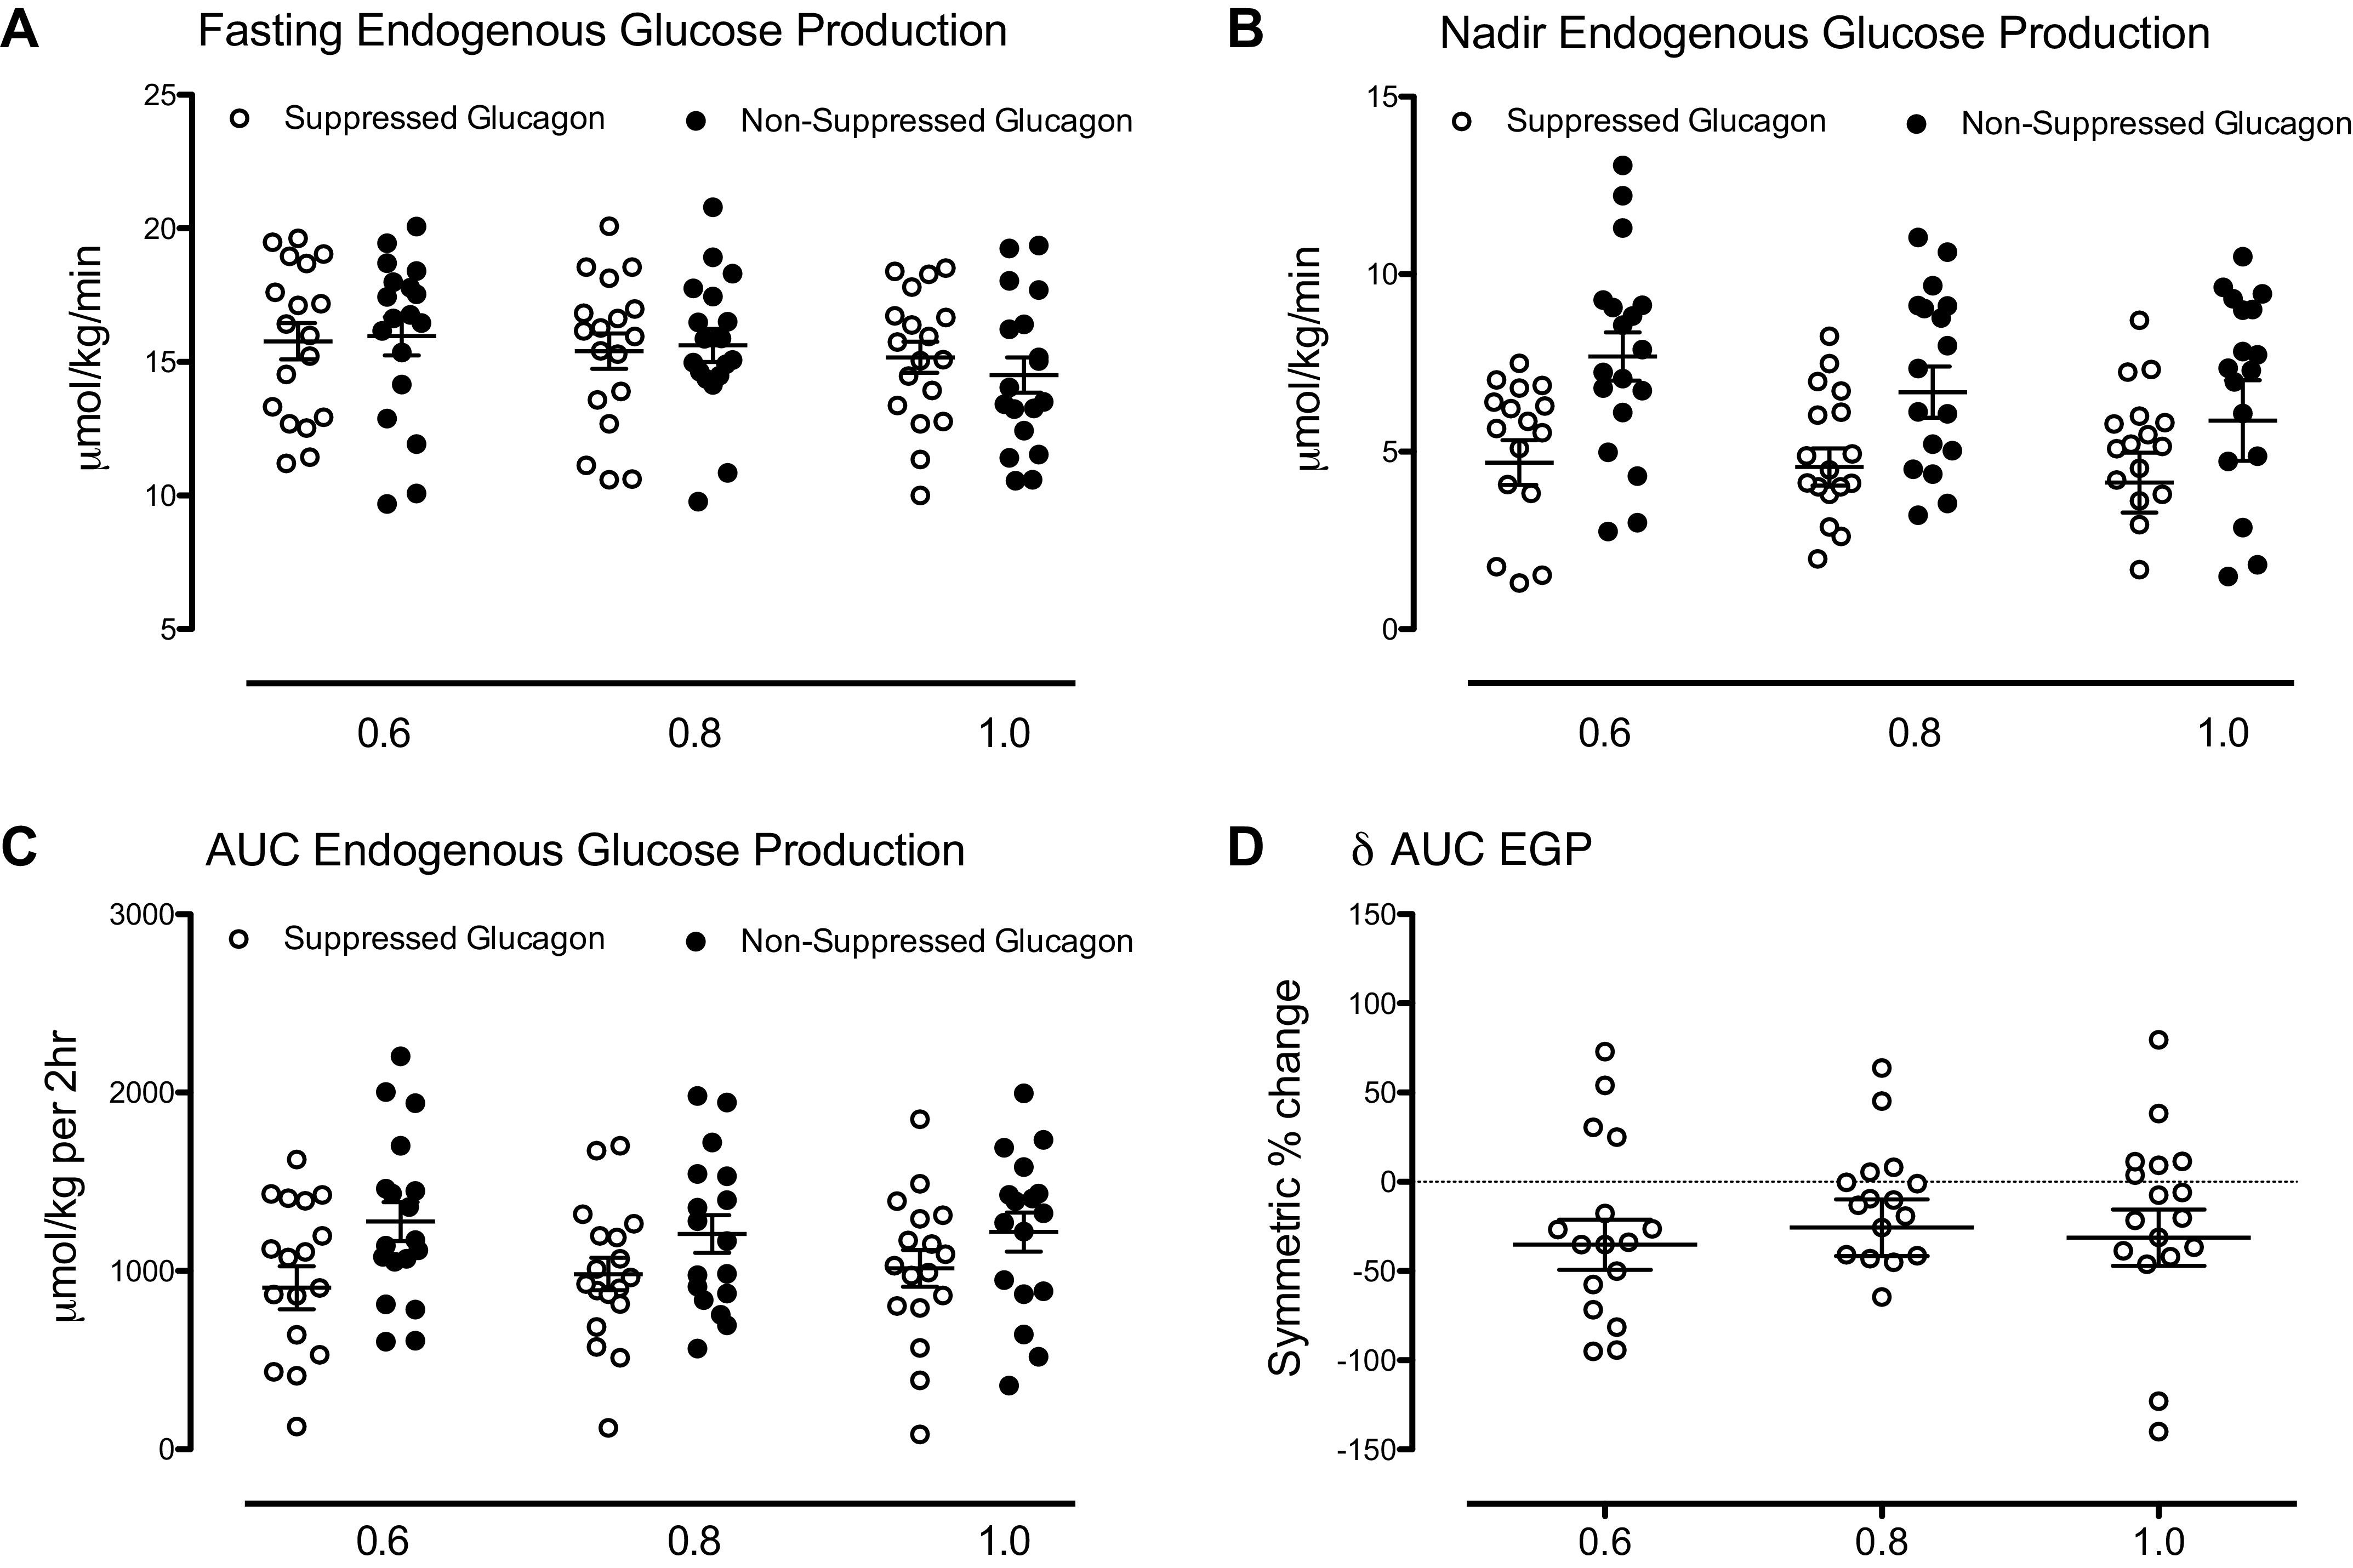
Figure 3.

Fasting (A), nadir (B), area under the curve (AUC; C), and symmetric % change of area under the curve (D) of rates of endogenous glucose production (EGP) in each of the three insulin dose groups. Data in A−C represent values observed during the suppressed (○) and the nonsuppressed (•) glucagon study day.
