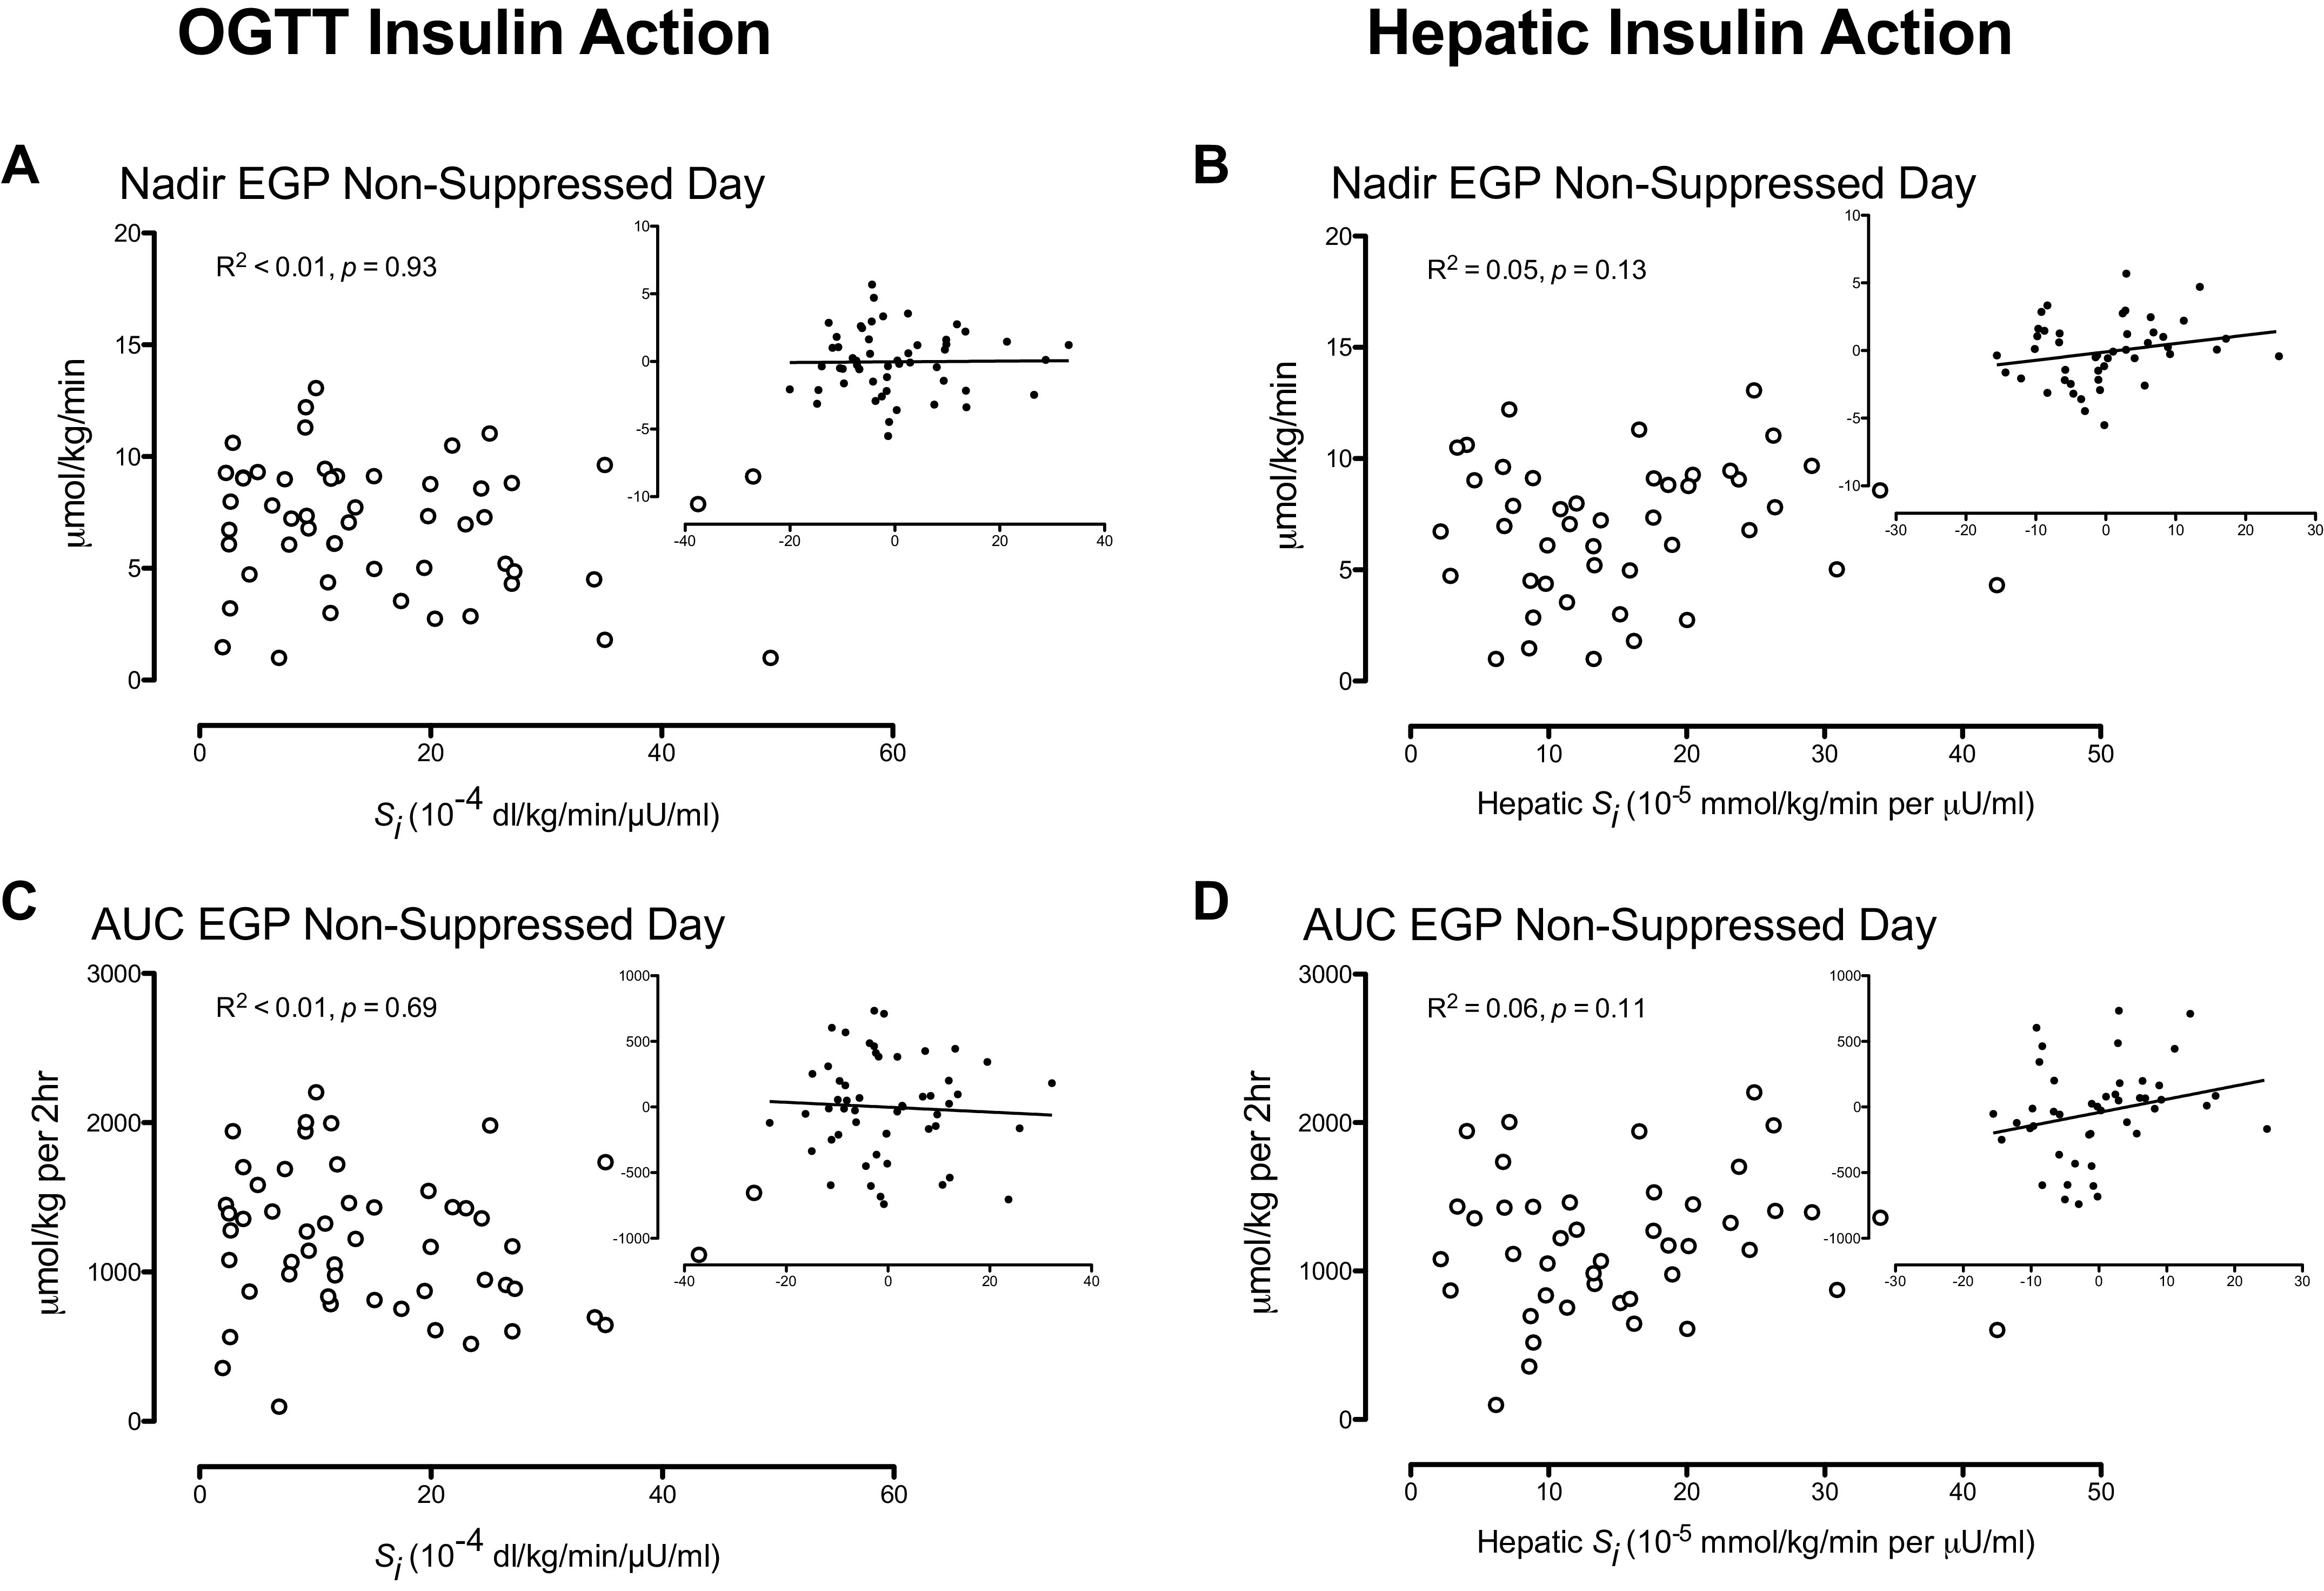
Figure 4.

Insulin action measured during an oral glucose tolerance test (OGTT) and hepatic insulin action measured from the endogenous glucose production (EGP) response to insulin during the suppressed glucagon study day did not correlate with nadir (A and B) and area under the curve (AUC; C and D) EGP. R2 and P values represent results from a multivariate analysis adjusting for the effects of age, sex, and weight. The inset panels represent residuals after adjusting for these covariates.
