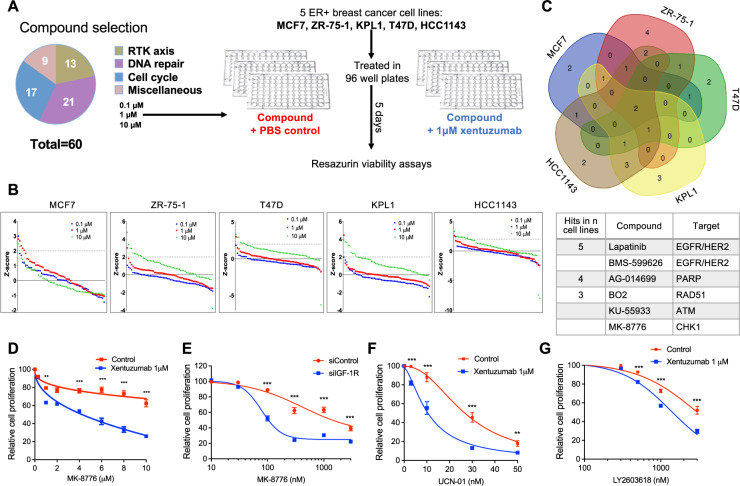
Fig. 2. Compound screen identifies drug combination of CHK1 inhibitor and IGF inhibitor.
A Compound library contained 59 small molecule drugs and controls (DMSO solvent for compounds, PBS for xentuzumab). MCF7, ZR-75-1, KPL1, T47D, HCC1143 were seeded in 96-well plates, treated with DMSO or library compounds at 0.1 µM, 1 µM, 10 µM with PBS or 1 µM xentuzumab and cell viability was determined after 5 days. B Cell viability data were used to calculate Z-scores as described in Supplementary Methods. Z-scores were ranked for all compounds for each cell line. Dotted line: Z-score = 2, threshold for hit identification. C Venn diagram showing overlap of hit compounds in five cell lines. Below: screen hits in at least three cell lines. D MCF7 cells were exposed to xentuzumab and MK-8776 for 5 days. E MCF7 cells were transfected with siControl or siIGF-1R for 24 h, and then exposed to solvent (control) or MK-8776 for 5 days. F, G MCF7 cells were exposed for 5 days to xentuzumab with UCN-01 (F) or LY2603618 (G) prior to cell viability assay. Data in (D–G) were expressed as % viability of solvent-treated control or siControl cells and represent mean ± SEM, pooled from n = 3 independent experiments. Two-way ANOVA of data in (D–G) indicated that both xentuzumab and IGF-1R depletion induced significant difference (P < 0.001) in the response to CHK1 inhibition; graphs show post-hoc analysis of significance at each drug concentration.

