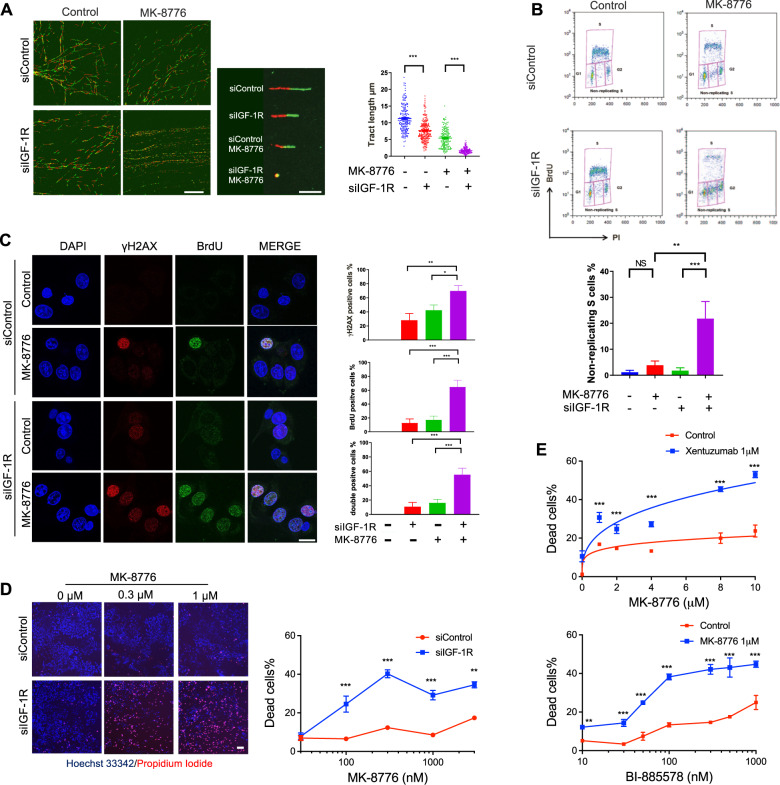
Fig. 3. CHK1 inhibition induces replication catastrophe in IGF-1R depleted cells.
A Representative images of DNA fibre tracts in MCF7 cells transfected with siControl or siIGF-1R for 24 h and then exposed to solvent or 300 nM MK-8776 for 24 h. Scale bar: 20 μm. Graph: quantification of fibre tract length (>150 tracts). B Flow cytometry analysis of cell cycle distribution of MCF7 cells after siRNA transfection for 24 h and then exposure to solvent or 300 nM MK-8776 for 24 h. Quantification of non-replicating S-phase cells is represented as mean ± SD, pooled from three independent experiments. These data were gated to exclude cells with >4 N DNA content; ungated data are shown in Supplementary Fig. S3E. C Representative images of BrdU and γH2AX immunofluorescence in MCF7 cells transfected with siControl or siIGF-1R for 24 h and then exposed to solvent or 300 nM MK-8776 for 24 h. Cells were cultured with 10 µM BrdU for 36 h before fixation and analysed in non-denaturing conditions to detect ssDNA. Scale bar: 20 µm. Graphs to right: upper, γH2AX-positive cells (>10 foci + pan-nuclear staining); centre, BrdU positive cells (>5 foci + pan-nuclear staining); lower, double-positive cells; ≥10 images were quantified. D Representative images of PI/Hoechst 33342 staining in MCF7 cells transfected with siControl or siIGF-1R for 24 h and then exposed to solvent or MK-8776 for 5 days. Scale bar: 200 μm. Graph below: dead cells % expressed as % PI-positive cells/Hoechst positive cells. Data represent mean ± SEM, pooled from three independent experiments. E MCF7 cells were exposed to xentuzumab (upper) or BI-885578 (lower) in combination with solvent or MK-8776 for 5 days. Dead cells expressed as mean ± SEM % PI-positive cells/Hoechst positive cells. For (D, E) there was a significant difference between each of the dose–response curves (P < 0.001) by 2-way ANOVA.

