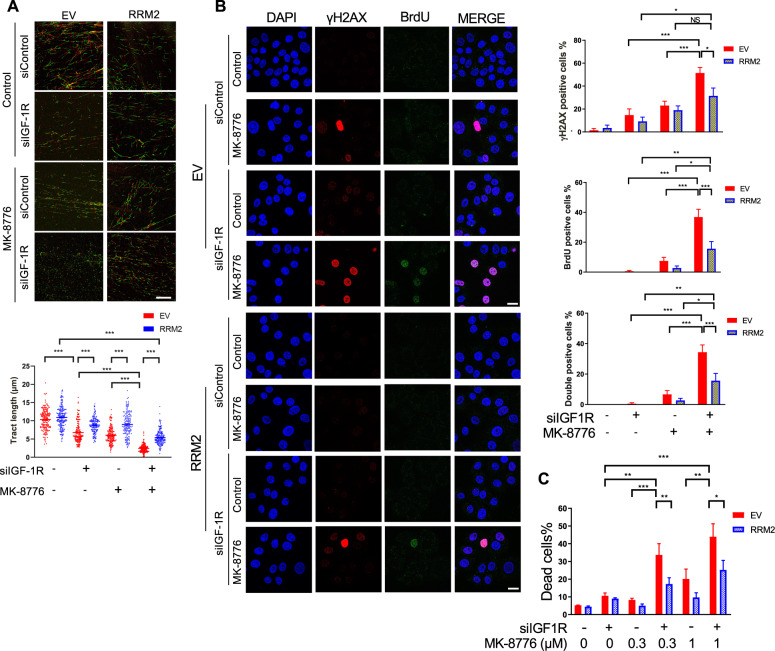
Fig. 5. RRM2 overexpression rescues replication catastrophe induced by CHK1 inhibition and IGF-1R depletion.
A Representative images of DNA fibre tracts in EV controls and RRM2-overexpressing cells transfected with siControl or siIGF-1R for 24 h and exposed to solvent or 1 µM MK-8776 for 24 h. Scale bar: 20 µm. Graph below: quantification of fibre tract length (>150 tracts). B Representative images of BrdU and γH2AX immunostaining in EV control cells and RRM2-overexpressing cells siRNA transfected and treated as (A), with addition of 10 µM BrdU for 36 h before fixation and analysis in non-denaturing conditions. Scale bar: 20 μm. Graphs to right: quantification of γH2AX-positive, BrdU positive and double-positive cells as in Fig. 3C; data represent mean ± SEM, pooled from 3 independent experiments. C EV controls and RRM2-overexpressing cells were transfected with siControl or siIGF-1R for 24 h and then exposed to solvent control or MK-8776 for 5 days, followed by PI/Hoechst 33342 staining to quantify dead cells, expressed as % PI-positive/Hoechst positive cells. Data represent mean ± SEM, pooled from three independent experiments each with three technical replicates.

