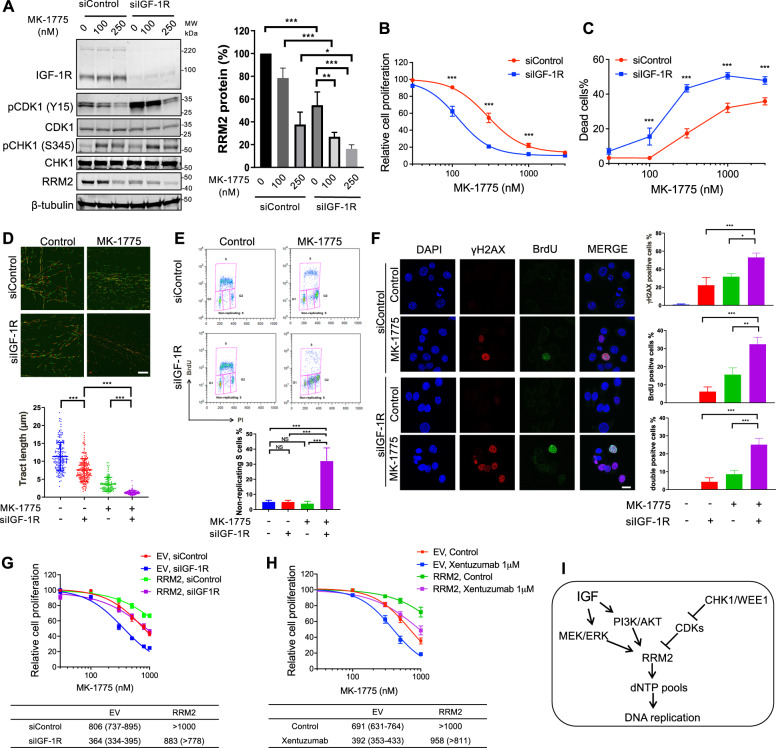
Fig. 7. WEE1 inhibition induces replication catastrophe in IGF-1R depleted cells.
A Western blot of MCF7 cells transfected with siControl or siIGF-1R for 24 h and exposed to solvent or MK-1775 for 24 h. Graph: RRM2 protein levels were quantified by ImageJ, corrected for β-tubulin and shown as mean ± SEM % of solvent-treated controls from 3 independent western blots. B, C MCF7 cells were transfected with siControl or siIGF-1R for 24 h and treated with solvent or MK-1775 for 5 days, followed by cell viability assay (B) or cell death assay (C), with significant differences (P < 0.001) in response to MK-1775 in both assays by 2-way ANOVA. D Representative images of DNA fibre tracts in MCF7 cells transfected with siControl or siIGF-1R for 24 h and exposed to solvent or 300 nM MK-1775 for 24 h. Scale bar: 20 μm. Graph below: quantification of fibre tract length (mean ± SEM of >150 tracts). E Analysis of MCF7 cell cycle distribution after transfection with siControl or siIGF-1R for 24 h and exposed to solvent or 300 nM MK-1775 for 24 h. Graph below shows quantification of non-replicating S-phase cells, mean ± SD, pooled from three independent experiments. F Representative images of native BrdU and γH2AX immunostaining in MCF7 cells transfected and treated as (E), and cultured with 10 µM BrdU for 36 h pre-fixation. Scale bar: 20 µm. Graphs to right: quantification of γH2AX positive, BrdU positive and double-positive cells as Fig. 3C; data represent mean ± SEM, pooled from three independent experiments. G EV controls and RRM2-overexpressing cells were transfected with siControl or siIGF-1R for 24 h, exposed to solvent or MK-1775 for 5 days, and cell viability was assayed. Data represent mean ± SEM, pooled from n = 3 independent experiments; below: IC50 values and 95% CI calculated from drug response curves. Two-way ANOVA showed similar differences in response to MK-1775 as in response to MK-8776 (Fig. 4D, E), with significant differences in siControl vs. siIGF-1R transfected EV cells, siControl vs. siIGF-1R transfected RRM2-overexpressing cells and siControl EV cells vs. siControl RRM2 transfectants (P < 0.001 for each comparison) but not in siControl EV cells vs. siIGF-1R transfected RRM2-overexpressing cells. H EV controls and RRM2-overexpressing cells were exposed to solvent or MK-1775 in the presence or absence of 1 µM xentuzumab for 5 days, followed by cell viability assay. Data represent mean ± SEM, pooled from n = 3 independent experiments with below, GI50 values and 95% CI. There were significant differences in response to MK-1775 in solvent controls vs. xentuzumab-treated EV cells, controls vs. xentuzumab-treated RRM2-overexpressing cells and control-treated EV vs. RRM2-overexpressing cells (P < 0.001 in each case) but not in control-treated EV cells vs. xentuzumab-treated RRM2-overexpressing cells. I RRM2 is regulated by IGFs and cell cycle checkpoint kinases CHK1 and WEE1, explaining profound RRM2 downregulation and replication catastrophe upon IGF:CHK1 or IGF:WEE1 co-inhibition.

