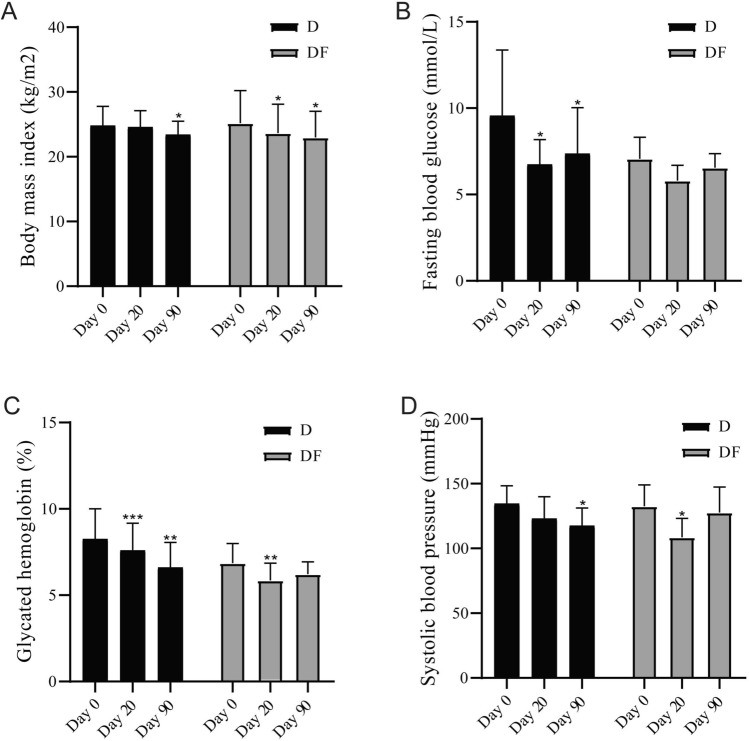
Figure 2.
Body measurement and biochemical indices changed by treatments. (A) The levels of body mass index at different time points in each group. (B) The levels of fasting blood glucose at different time points in each group. (C) The levels of glycated hemoglobin at different time points in each group. (D) The levels of systolic blood pressure at different time points in each group. *p < 0.05 vs baseline; **p < 0.01 vs baseline; ***p < 0.001 vs baseline. Two-tailed Student’s t test for paired-samples.

