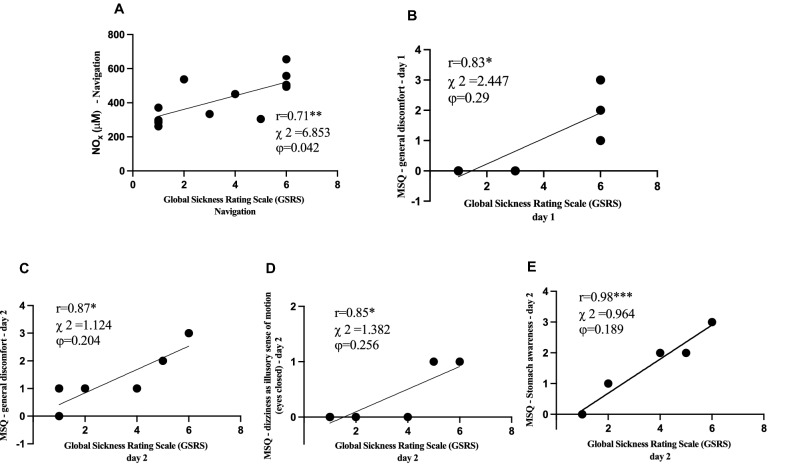
Figure 3.
Relationship panel plot of: (A) NOx and GSRS during navigation; (B) GSRS and general discomfort of MSQ at 1st day; at the 2nd day, the panels show the correlation between GSRS and specific items of MSQ. (C) General discomfort and GSRS. (D) Dizziness as illusory sense of motion (eyes open) and GSRS. (E) Stomach awareness and GSRS. A significant linear relationship (p < 0.05–0.001) between parameters was estimated. The correlation coefficient (r), Chi-Square (χ2) and Phi coefficient (ϕ) are reported. Figure created with: GraphPad Prism, GraphPad Software inc. California, USA, version 9.0.1, https://www.graphpad.com/.

