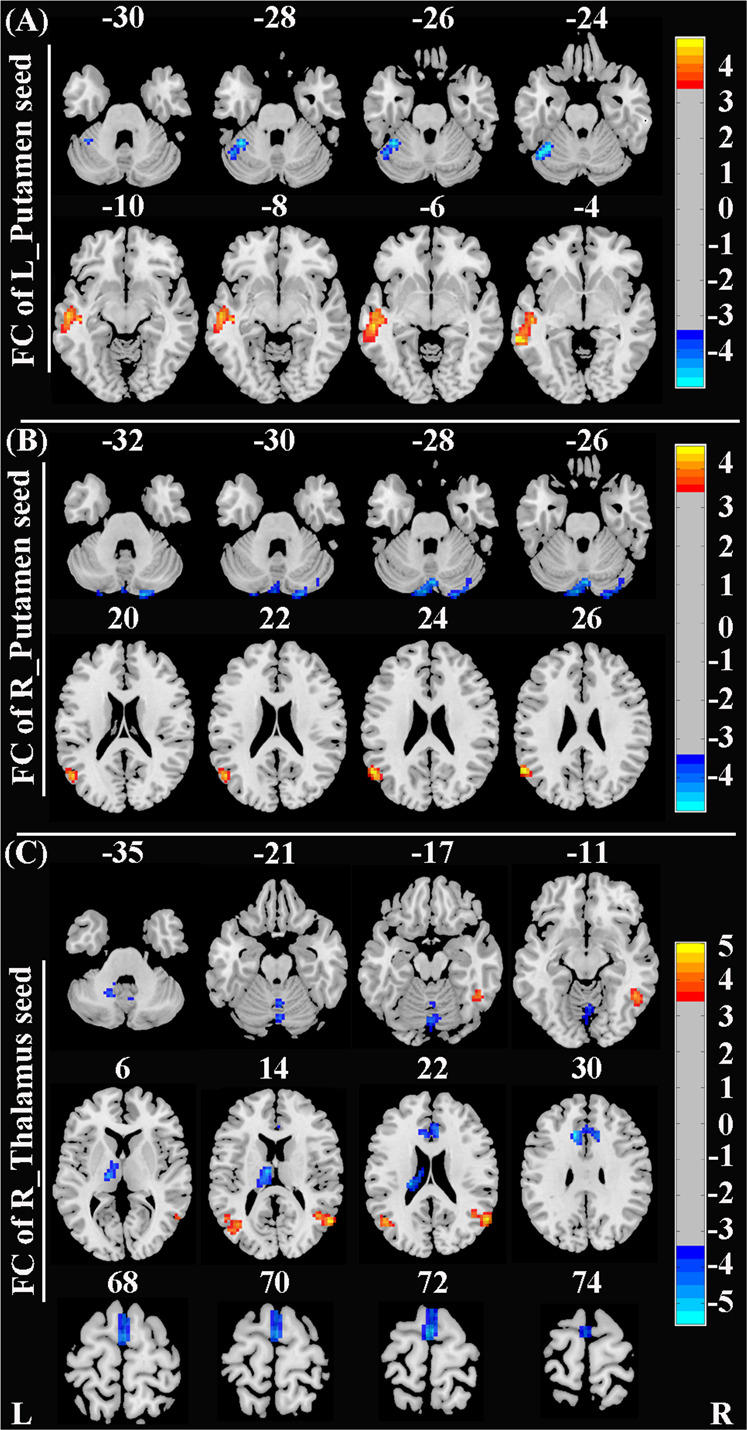
Fig. 2. Brain regions with significant differences in rs-FC between SAD patients and HCs (corrected with Gaussian random field theory with a significance threshold of a voxel-wise value of P < 0.001 and cluster probability of P < 0.05).

Warmer colors (positive values) represent increased rs-FC, while cooler colors (negative values) represent decreased rs-FC in SAD patients compared to HCs. Abbreviations: HCs, healthy controls; L, left; R, right; rs-FC, resting-state functional connectivity; SAD, social anxiety disorder.
