
Figure 1.
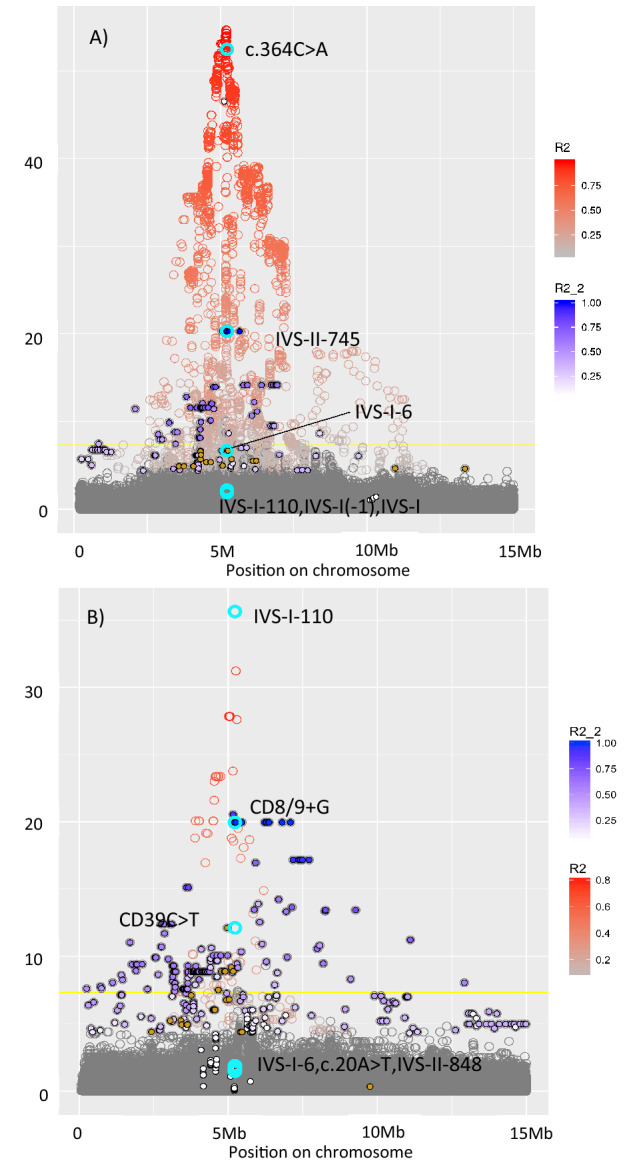
Regional association plot for variants located between 0 and 15 Mb on chromosome 11. Each circle represents a genetic variant. They are arranged on the x-axis by their location. The y-axis shows the p-value for their association with red cell distribution width in (A) Pomak and (B) MANOLIS. Pathogenic HBB mutations are highlighted in turquoise and labelled. The colouring of the circle (R2) indicates the strength of linkage disequilibrium (LD) with the most strongly associated HBB mutation, c.364C>A in MANOLIS and IVS-I-110 in Pomak. The blue filling of points (R2_2) indicates the strength of LD with the second most strongly associated HBB mutation, IVS-II-745 in MANOLIS and CD8/9+G in Pomak. The brown filling of the circle indicates variants in LD with the third most strongly associated HBB mutation, IVS-I-6 in MANOLIS and CD39C>T in Pomak.