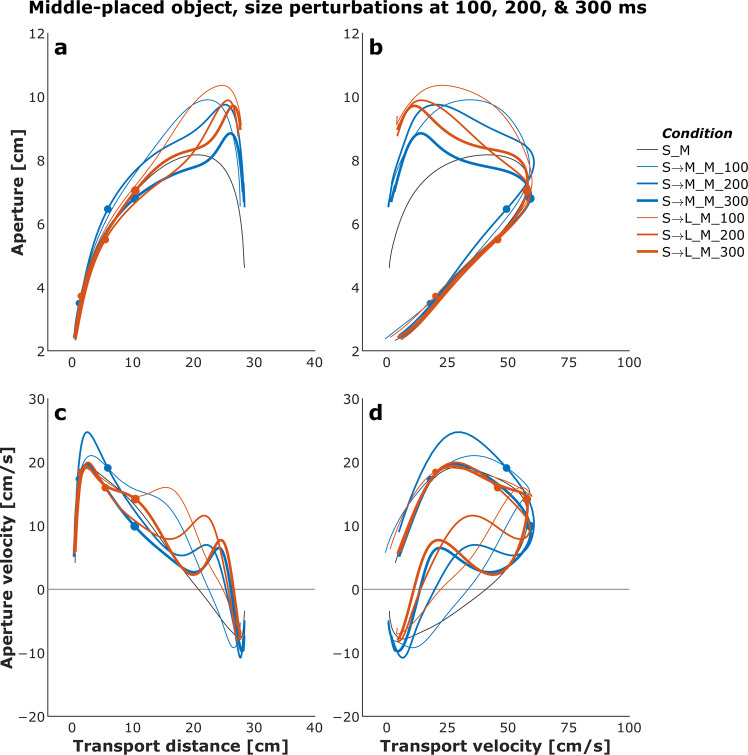
Fig. 7.
Phase plots of mean transport and aperture kinematics for the control (no perturbation) and a selected set of size-perturbation conditions (perturbation applied at 100 ms, 200 ms, or 300 ms after movement onset) for a representative participant. (a) Aperture versus transport distance. (b) Aperture versus transport distance. (c) Aperture velocity versus transport velocity. (d) Aperture velocity versus transport velocity. Each profile describes only the first 1000 ms of movement. Legend format: Object Size_Object Distance; arrows indicate perturbation of object size. Gray vertical dashed-dotted lines and solid circles indicate the timing of the perturbations.

