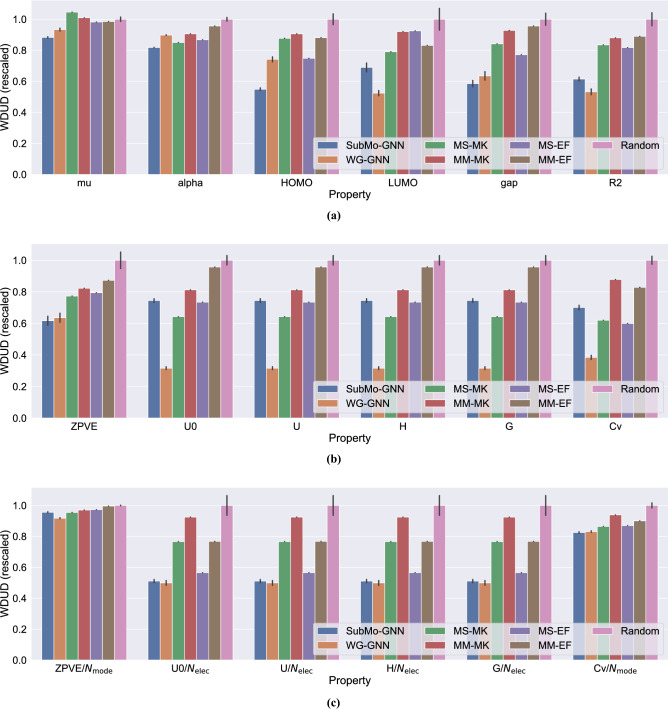
Figure 4.
Bar charts of WDUD values. All the values are rescaled so that those of Random become 1. (a) Shows the results on the first six properties. (b) is the results on the six properties correlated with or (the WDUD values are computed with the raw property values). (c) is a modified version of (b), where the property values are divided by or for making those values capture subtle molecular characteristics such as connectivity patterns.

