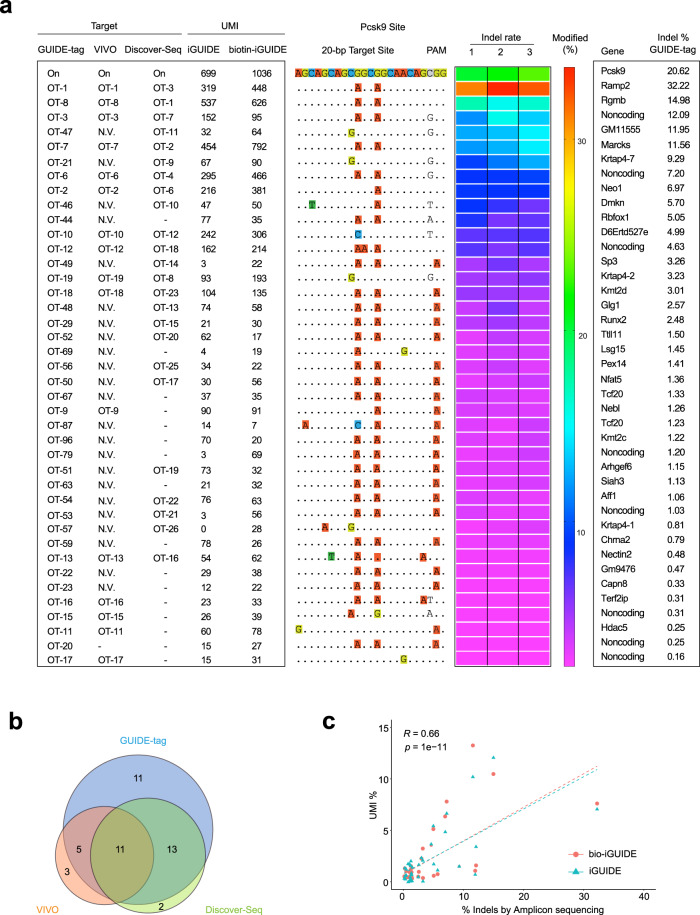
Fig. 3. Comparisons of off-target sites discovered by GUIDE-tag, VIVO, and Discover-seq at Pcsk9 locus.
a Comparison of off-target site detection for a promiscuous sgRNA targeting Pcsk9 (Pcsk9-gP or sgPcsk9) by GUIDE-tag, VIVO, and Discover-seq. For GUIDE-tag analysis genomic DNA was isolated from the liver of mice injected with plasmid expressing sgPcsk9-SpyCas9-mSA* plus iGUIDE or biotin-iGUIDE donors (n = 3). UMI numbers recovered for each site are shown (Average of three mice). Mismatches relative to the on-target site are shown with colored boxes. Indel frequencies determined by targeted amplicon sequencing from the liver of three mice are presented as a heat map (1,2,3 are three mice) and average indel% (right). Forty of 52 tested GUIDE-tag discovered off-target sites show statistically significant indels (p < 0.05) (ranked by average indel%). N.V, not verified, identified by CIRCLE-seq but not chosen for validation in the VIVO study. Dash, off-target site not identified by VIVO or DISCOVER-seq. b Venn diagram of the overlap of validated off-target cleavage sites discovered by GUIDE-tag (40 validated loci), VIVO (19 validated loci), and DISCOVER-seq (26 loci) for sgPcsk9. Note only a subset of potential off-target sites were tested in each study. c Scatter plots of average indel frequency (x-axis, targeted amplicon deep sequencing) and average UMI% (y-axis, n = 3 mice) for verified sgPcsk9 off-target sites identified by GUIDE-tag. Dashed lines represent the linear regression fit (Spearman’s correlation calculated). The p-value for Pearson’s correlation coefficient was determined by the two-tailed t-distribution table. Source data are provided as a Source Data file.

