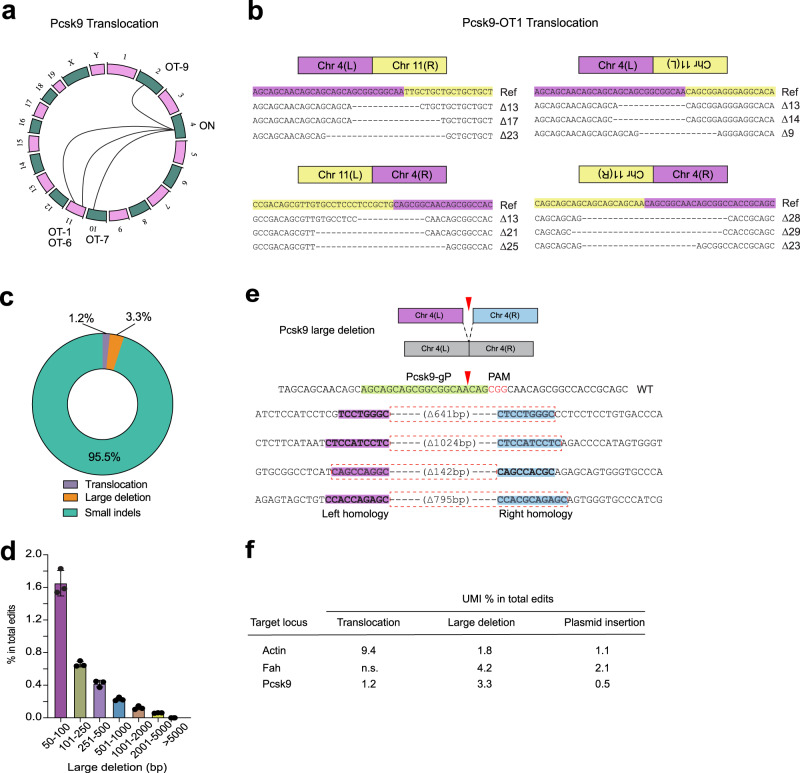
Fig. 4. Analysis of in vivo translocations and large deletions by UDiTaS.
a Circos plots of statistically significant translocations identified by UDiTaS at Pcsk9 locus. Translocations are shown as arcs between the Pcsk9 site and the chromosome position of each off-target site. b Examples of ligation junctions of translocations between the Pcsk9 site on chromosome 4 and the OT1 off-target site on chromosome 11. Reference (Ref) sequence is the predicted junction of the translocation for a precise ligation between the anticipated cleavage positions for the on-target and off-target site. The sequences below show representative small deletions for different translocation junctions that were observed. L and R denote left and right chromosome arms. c Fraction of edits that are small indels (<50 bp), large deletions (>50 bp) and translocations at Pcsk9 site by UDiTaS. Numbers are average of 3 mice. d Length distribution of large deletions (>50 bp) at Pcsk9 site. Values are mean ± SD (n = 3 mice). e Examples of large deletions at Pcsk9 site. Short homology arms present at the deletion junction are labeled magenta and blue, where the segment in the dotted red box is lost (including one of the homology arms) likely due to MMEJ-based repair. f Summary table of translocations and large deletion frequency detected by UDiTaS among all edited (non-wild type) sequences at three target sites. Vector insertion indicates the presence of plasmid sequence at the target site. n.s., not significant. Source data are provided as a Source Data file.

