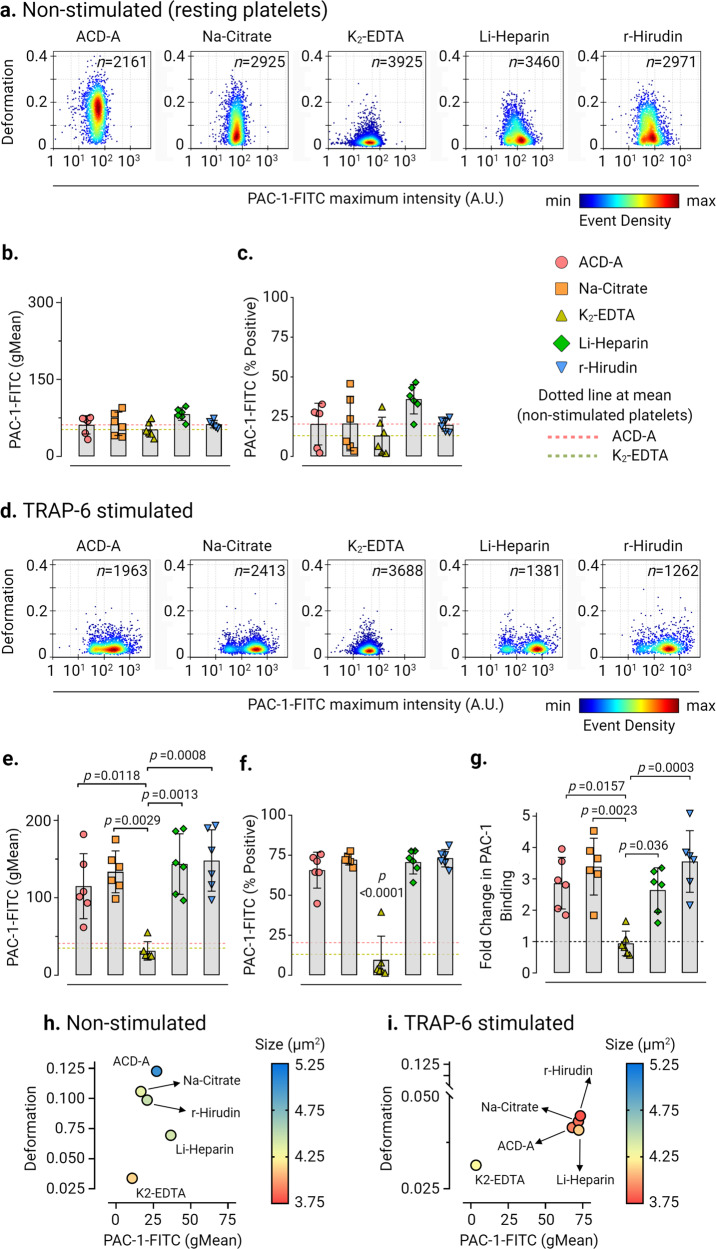
Fig. 3. Platelet deformation and activation-induced exposure of the conformational epitope of the integrin αIIbβ3 is strongly influenced by ex vivo anticoagulants.
Representative KDE scatter plots of platelet deformation and their corresponding activation status as a readout for binding of integrin αIIbβ3 specific ligand-mimetic PAC-1 antibody (plotted on log10 scale of maximum intensity in arbitrary units (AU) of PAC-1-FITC antibody) on single platelets in different ex vivo anticoagulants in (a) non-stimulated (i.e., resting) platelets and upon stimulation TRAP-6 (d) from a single donor (n= number of single platelets from the same donor measured for each condition). Color coding of event density in scatter plots indicates a linear density scale from min (blue) to max (dark red). Summary graphs show of median values of individual donors, while bar graphs show mean ± SD of geometric mean fluorescence intensity (gMean) of PAC-1-FITC antibody bound to platelets (b) and (e) and PAC-1-FITC antibody percent positive platelets (c) and (f) above the cut-off of 5000 events or 10 min in non-stimulated and TRAP-6 stimulated platelets, respectively (n = 6 donors). Fold change in PAC-1 Binding on platelets upon stimulation with TRAP-6 from six donors are shown in (g) where dotted control baseline = 1 (n = 6 donors). Multivariate analysis plots of continuous variables from RT-FDC, (h) and (i) of non-stimulated and TRAP-6 stimulated platelets, respectively, displaying the relationships between platelet deformability, size, and PAC-1 antibody biding to integrin αIIbβ3 in different ex vivo anticoagulants. (Data represents median values of individual variables from n = 6 donors). Statistical analysis: mixed-effects model (restricted maximum likelihood, REML) followed by Tukey’s multiple comparisons tests, with single pooled variance and p < 0.05 was considered significant.

