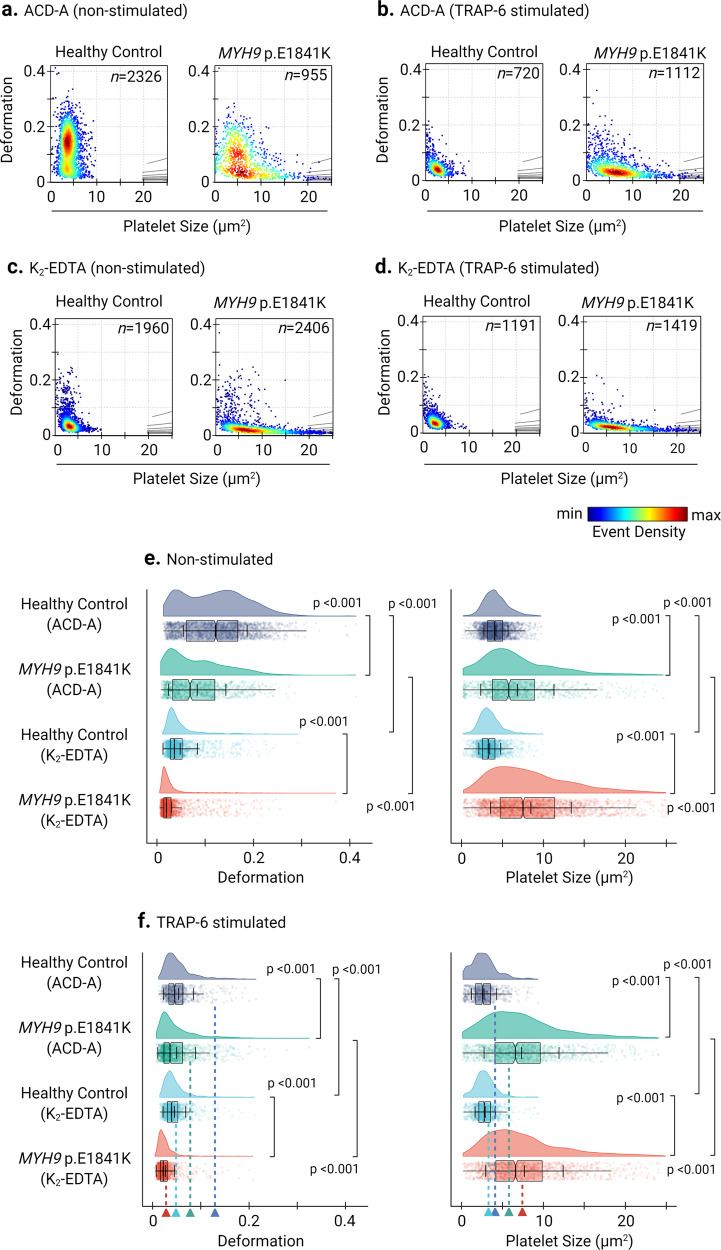
Fig. 7. Deformability and size of platelets from a healthy individual and from a patient carrying MYH9 p.E1841K mutation.
KDE scatter plots from RT-FDC measurements performed on the same day of displaying the distribution of single platelet deformability and their corresponding size between single platelets from a healthy individual (control) and from a patient carrying the mutation MYH9 p.E1841K for non-muscle myosin heavy chain IIa, in ex vivo anticoagulant (a) ACD-A and (c) in K2-EDTA before and after stimulation with platelet agonist TRAP-6, (b) and (d), respectively (n = number of single platelets). Statistical distribution plots for platelet deformation and size for (e) non-stimulated and (f) TRAP-6 stimulated platelets from each experimental condition from figure panels (a) through (d). Notch in the box plot and the horizontal line depicts median and mean, respectively, and the interquartile ranges. The full distribution of the data for each parameter is depicted by half-violin plots and staggered dots and dotted lines with arrowheads represent the median values of respective parameters from the non-stimulated platelets. Statistical assessment by Kruskal–Wallis test followed by Dunn’s multiple comparisons test. p < 0.05 was considered significant.

