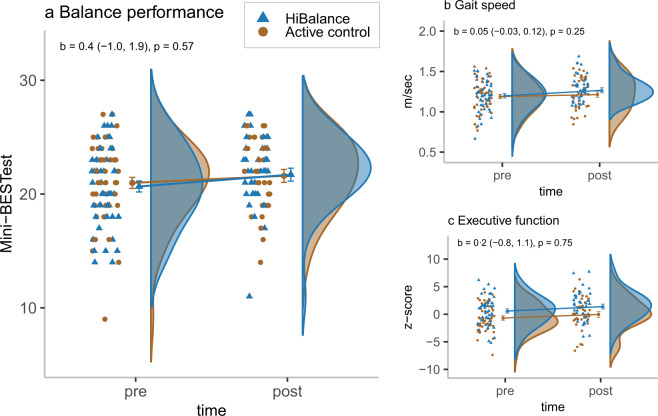
Fig. 2. Effects of the HiBalance programme.
The mean values, the standard error of the mean (error bars) as well as the b values, e.g., the unstandardised estimates of the time by group interaction, and their 95% CIs, are predicted values based on the intention to treat analyses. The participants’ point estimates, and their distributions are observed values. a Mini-BESTest (range 0–28), b Gait speed (m/s), c executive function (composite score of four tests from the Delis–Kaplan Executive Function System and the Wechsler Adult Intelligence Scale, z-scores).

