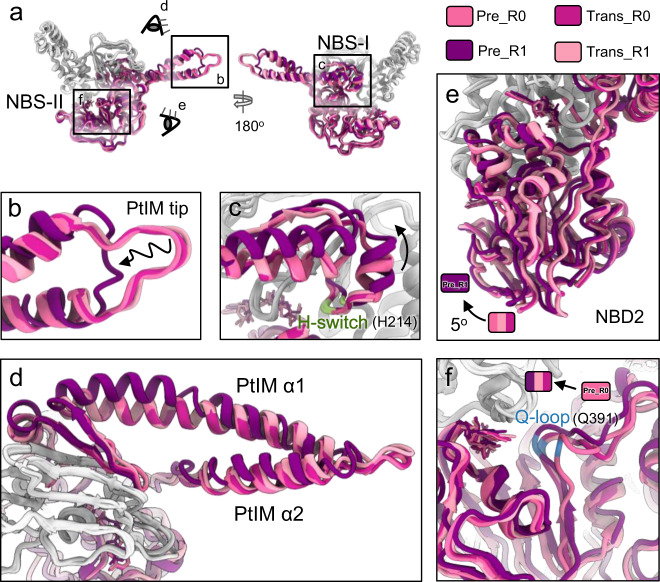
Fig. 4. Structural plasticity of MtbEttA in the pre-hydrolysis and transition states.
a Overall structural comparison of MtbEttA in the pre-hydrolysis and transition states. Models are aligned based on NBD1. NBD1 and arm domain are colored in light gray. PtIM and NBD2 are colored from light pink to dark purple for different states. The close-up views of the tip of PtIM and the base of PtIM α1 are shown in (b and c), respectively. Residue H214 of the H-switch in NBD1 is colored in pale green. d Top view of MtbEttA from the direction of the eye cartoon in a. Focused views of NBD2 and the Q-loop in NBD2 are shown in (e and f), respectively. The curved arrow indicates the rotation of NBD2 in (e), and Residue Q391 is colored in dodger blue in (f). Nucleotides are shown as stick models in (c, e, and f).

